[Week 16] Learning Mixpanel: Dashboards in depth
![[Week 16] Learning Mixpanel: Dashboards in depth](/content/images/size/w1200/2026/02/4ac0dc6b-c8dc-4ca9-9575-c0dc9f2a3080_944x624.png)
Introduction
Welcome to Week 10 of Learning Mixpanel. I’m Ansh, a Mixpanel Certified Partner. I’ve had the privilege of working with 60+ startups, helping them set up their analytics infrastructure and gain actionable insights using Mixpanel.
Curious about my work? Check out my website for case studies, testimonials, and more details about what I do.
Tired of Mixpanel data going wrong - events missing, properties breaking, or random spikes?
Pravix makes it simple to detect these issues and keep your data clean.
Today, I’m going to talk about how to build dashboards in Mixpanel
Let’s get into it
If your preferred consumption is audio visual - access the video on Youtube
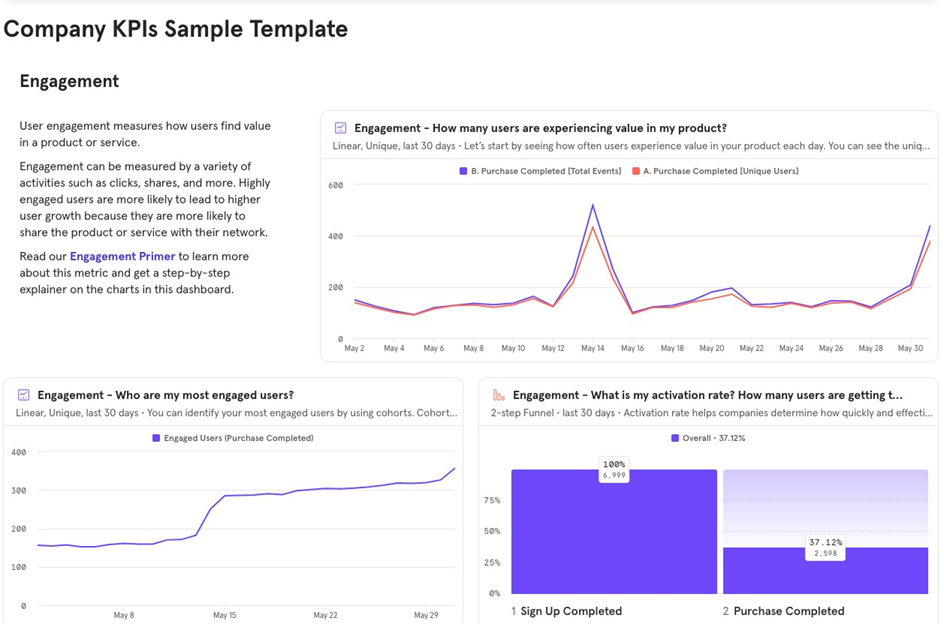
Dashboards
Dashboards let you combine and visualize multiple reports together in one place.
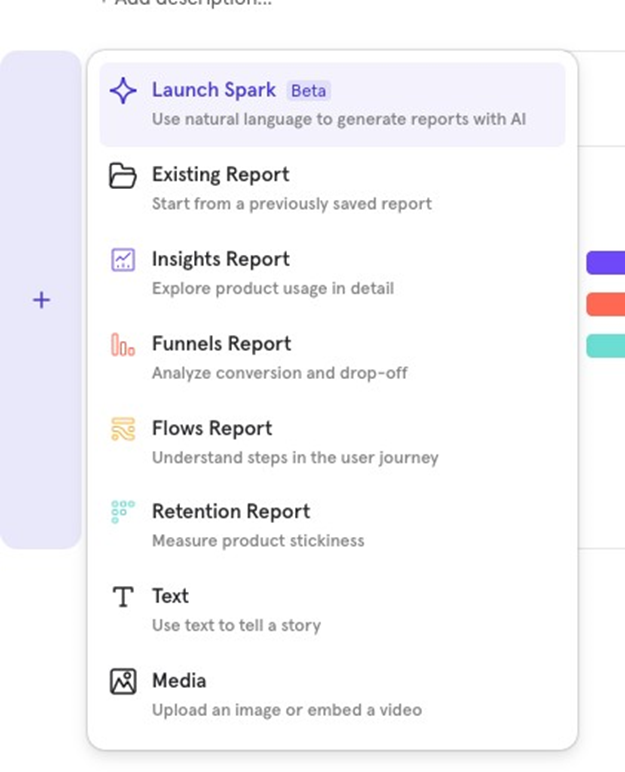
You can also add text and images to your dashboard. Hover on the left side, click the “+ˮ icon, and choose what to add.
Dashboard Filters
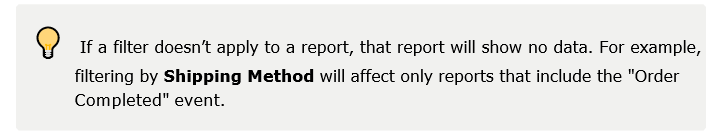
Dashboard filters allow you to filter all reports in the dashboard at once. These filters override any filters applied at the individual report level.
Example: If you set a dashboard filter to show data for the Last 30 Days, all reports will reflect this, ignoring any individual report filters.
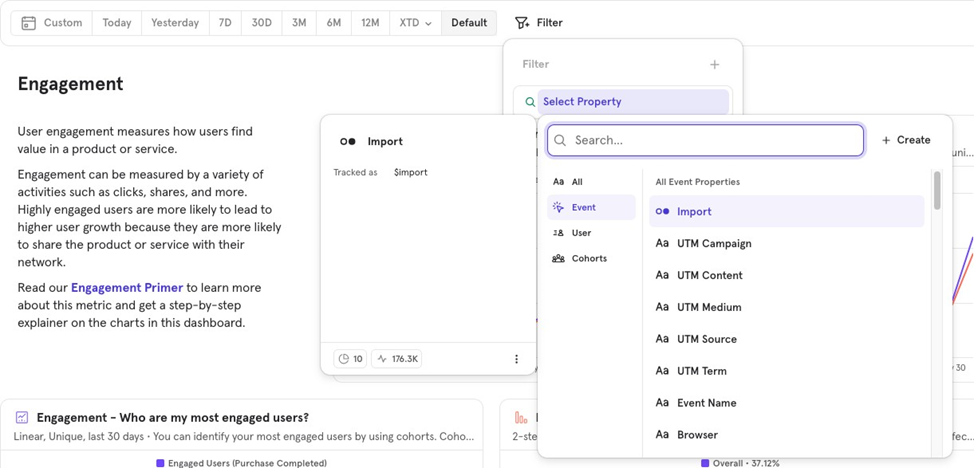
There are multiple types of Dashboard Filters that you can use:
- Timeline (e.g., Last 30 days)
- Event Properties
- User Properties
- Cohorts
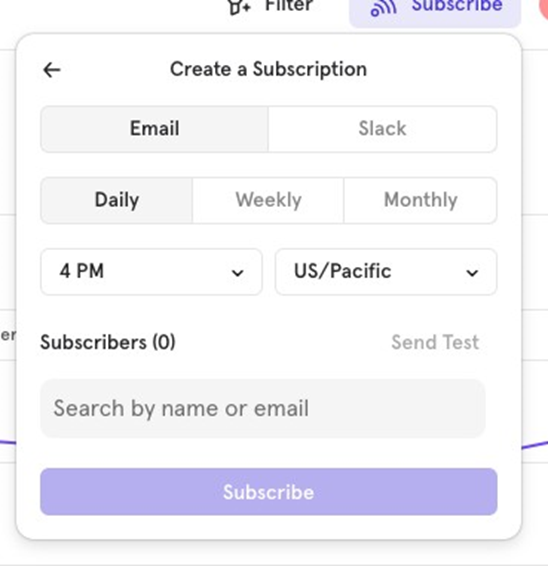
Dashboard subscriptions
You can set up dashboard subscriptions to receive a snapshot of the dashboard via Slack or email on a recurring basis.
Subscriptions will only include the top 8 reports on the dashboard.

![[Week 28] Learning Mixpanel: Computed Properties](/content/images/size/w600/2026/02/e73fb366-1c52-4f79-a28f-4a0b60d6998c_836x723.png)
![[Week 27] Learning Mixpanel: Bucket Customisation Types](/content/images/size/w600/2026/02/a81f7bcb-4886-4711-b1b8-af8c5fc6b1b8_463x476.png)
![[Week 26] Learning Mixpanel: Mastering Attribution with Mixpanel](/content/images/size/w600/2026/02/4e3a164c-bfb1-479f-9f09-2f8890eac413_885x787.png)