[Week 17] Learning Mixpanel: Advanced report features
![[Week 17] Learning Mixpanel: Advanced report features](/content/images/size/w1200/2026/02/92caa02f-8078-4e57-b3db-121a68f0b0dd_982x469.png)
Introduction
Welcome to Week 10 of Learning Mixpanel. I’m Ansh, a Mixpanel Certified Partner. I’ve had the privilege of working with 60+ startups, helping them set up their analytics infrastructure and gain actionable insights using Mixpanel.
Curious about my work? Check out my website for case studies, testimonials, and more details about what I do.
Tired of Mixpanel data going wrong - events missing, properties breaking, or random spikes?
Pravix makes it simple to detect these issues and keep your data clean.
Today, I’m going to talk about how to use advanced report features in Mixpanel
Let’s get into it
If your preferred consumption is audio visual - access the video on Youtube
Reports → Additional features
You can enhance reports by adding annotations, creating cohorts, or setting up alerts. Letʼs explore each of these features.
Annotation
Annotations let you add notes to charts, providing context for key data points. They are available in all forms of Line Charts: Line, Stacked Line, Column, and Stacked Column.
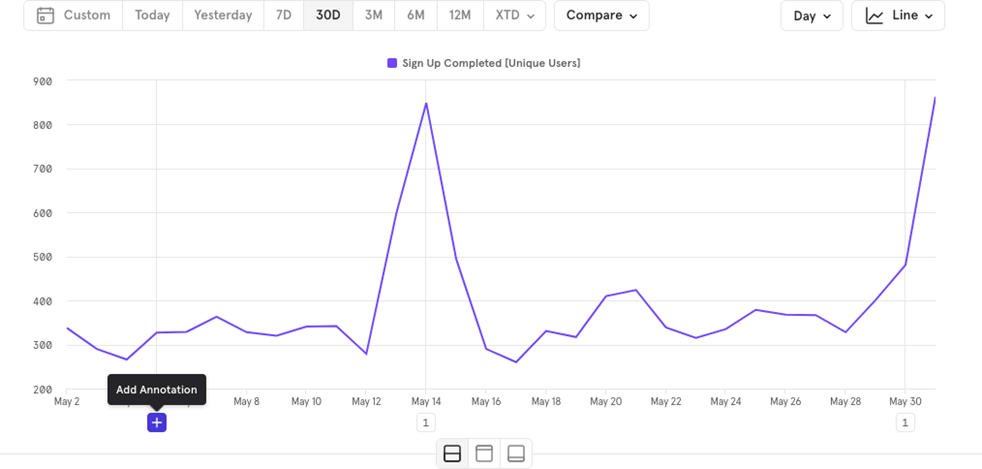
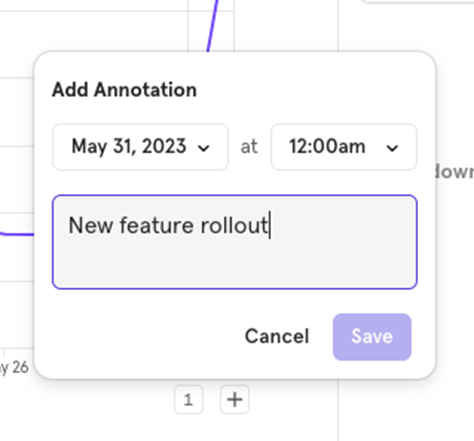
Example: You can add an annotation to explain a spike in signups on a particular date.

![[Week 28] Learning Mixpanel: Computed Properties](/content/images/size/w600/2026/02/e73fb366-1c52-4f79-a28f-4a0b60d6998c_836x723.png)
![[Week 27] Learning Mixpanel: Bucket Customisation Types](/content/images/size/w600/2026/02/a81f7bcb-4886-4711-b1b8-af8c5fc6b1b8_463x476.png)
![[Week 26] Learning Mixpanel: Mastering Attribution with Mixpanel](/content/images/size/w600/2026/02/4e3a164c-bfb1-479f-9f09-2f8890eac413_885x787.png)