[Week 28] Learning Mixpanel: Computed Properties
![[Week 28] Learning Mixpanel: Computed Properties](/content/images/size/w1200/2026/02/e73fb366-1c52-4f79-a28f-4a0b60d6998c_836x723.png)
Introduction
Welcome to Week 28 of Learning Mixpanel. I’m Ansh, a Mixpanel Certified Partner. I’ve had the privilege of working with 60+ startups, helping them set up their analytics infrastructure and gain actionable insights using Mixpanel.
Curious about my work? Check out my website for case studies, testimonials, and more details about what I do.
Tired of Mixpanel data going wrong - events missing, properties breaking, or random spikes?
Pravix makes it simple to detect these issues and keep your data clean.
Today, I’m going to talk about how to use computed properties in Mixpanel.
Let’s get into it
If your preferred consumption is audio visual - access the video on Youtube
Computed Properties are aggregated properties calculated by Mixpanel that can be used in a filter or breakdown. You can find them under the Computed section when selecting a property to breakdown.
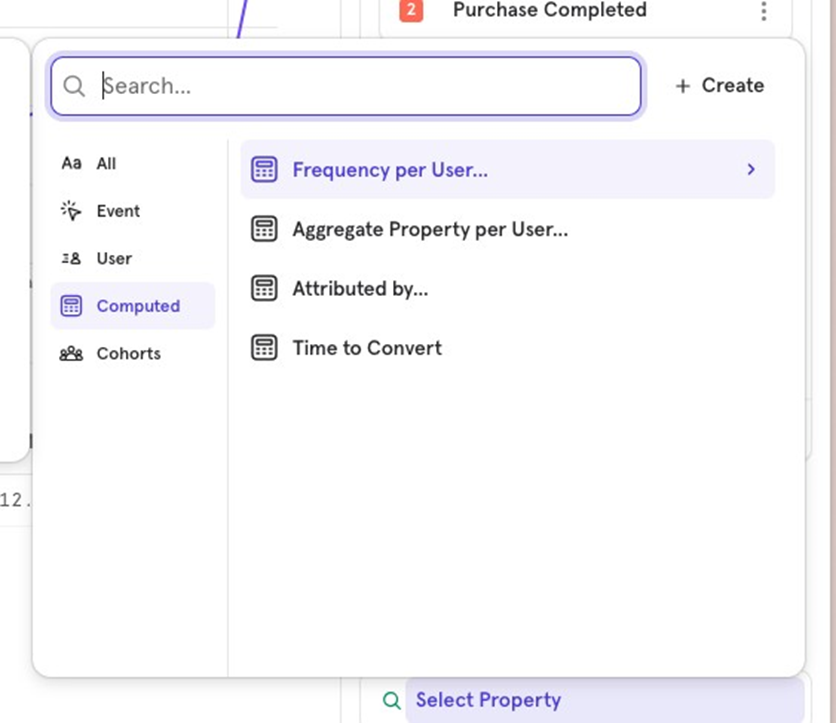
There are four types of computed properties:
- Frequency per user
- Aggregate property per user
- Duration (in Insights report)
- Time to Convert (in Funnels report)
Letʼs dive into each one of them.
Frequency per user
Frequency per user helps you break down a funnel based on the number of times a user has performed a specific event within a defined time period.
Example:
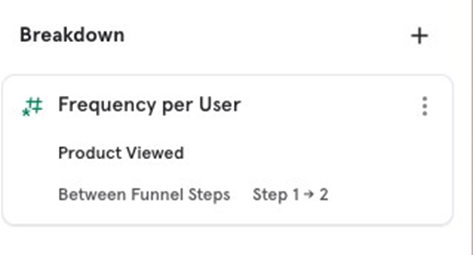
You want to understand how many products a user needs to view between Sign Up and Purchase Completed to achieve the highest conversion rate.
In this case, you can break down the Sign Up to Purchase Completed funnel by choosing Frequency per user and selecting Product Viewed as the event.
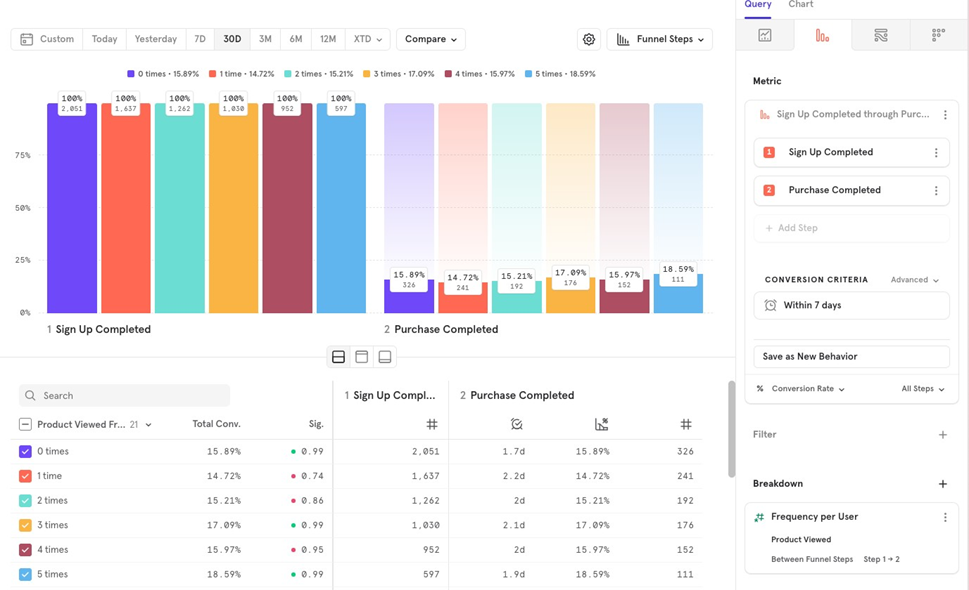
From the breakdown, it’s clear that users who view 5 products after signing up have the highest likelihood of completing a purchase.
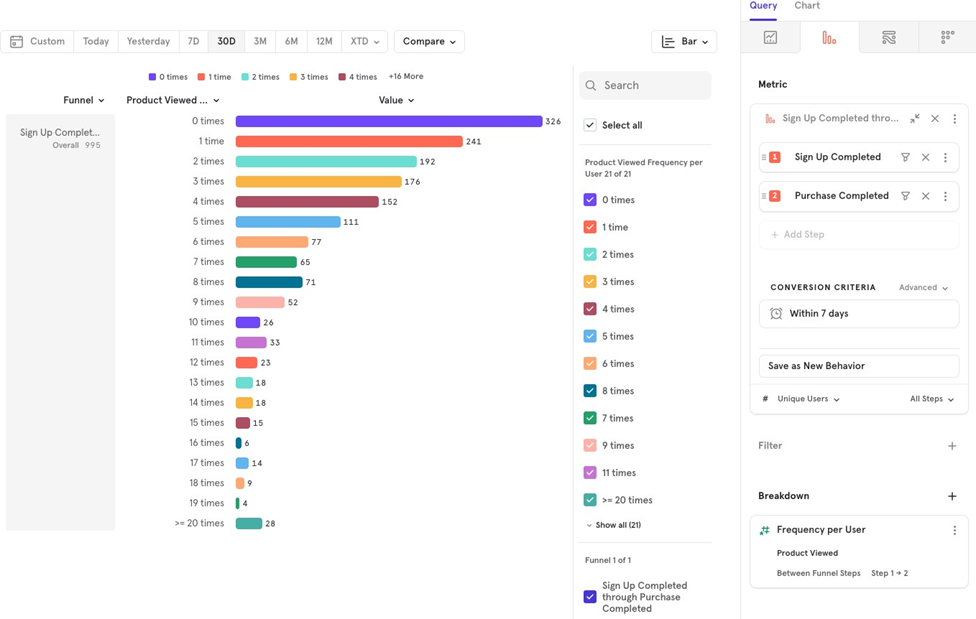
If you want to analyze the distribution of products viewed by users who completed a purchase, you can do that as well. This shows how many products users typically viewed between signing up and purchasing.
- Change the chart type from Funnel steps to Bar chart.
- Change the conversion criteria from % conversion to Unique Users.
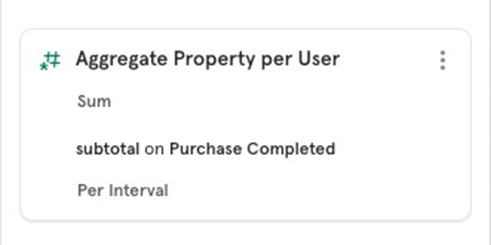
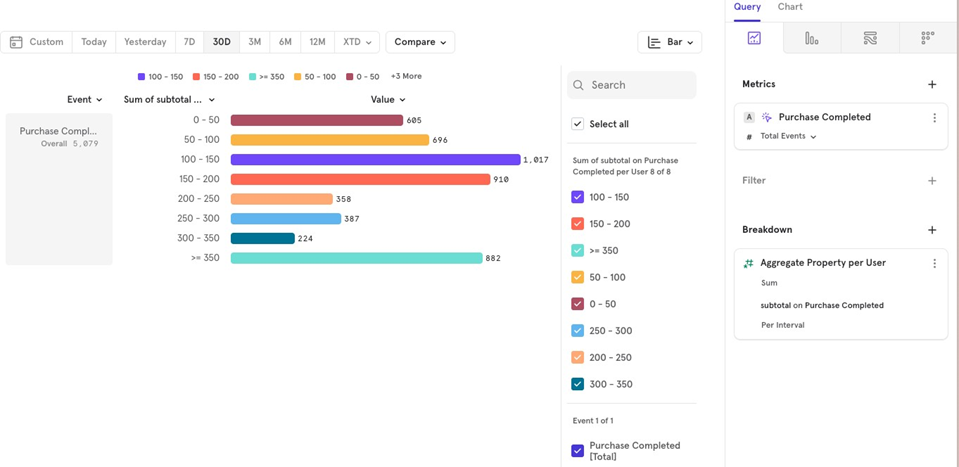
Aggregate property per user
Aggregate property per user allows you to break down a report based on an aggregated calculation applied to each user. This is useful when you want to analyze behavior on a per-user basis, such as the total value of purchases made by an individual user over a specific time period.
Example:
Youʼre analyzing Purchase Completed events in the last 30 days and want to break them down based on the total purchase value (sum of subtotal) per user. This can help you understand how many users made purchases with a total value greater than 300, less than 300, and so on.
Duration
The Duration property calculates the time between two instances of the same event and is useful for analyzing time spent on pages or screens. However, it comes with some limitations and trade-offs.
Here’s how the Duration property works:
- It calculates the time difference between two occurrences of the same event.
- This makes it particularly effective for page view or screen view events that occur consecutively.
Example:
If you track Page Viewed events, the Duration property will give you the time difference between two consecutive Page Viewed events, essentially calculating how long the user stayed on one page before moving to another.
Limitations:
- Consecutive Event Dependency: It only works when events are fired in succession. For example, if a user views Page A, then navigates to Page B, the Duration property calculates the time difference between those two events.
- Handling User Drop-off: If a user drops off after visiting Page A and the Mixpanel session ends (default is 30 minutes of inactivity), no duration will be recorded for Page A if the session times out. Upon returning in a new session, the duration will reset to 0.
- Session Mismatch: If a user navigates away from Page A and returns to Page B after a significant time (e.g., 15 minutes), the duration recorded for Page A could be inflated, showing 15 minutes even though the user was not actually on the page.
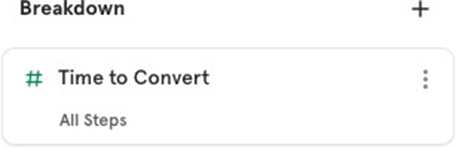
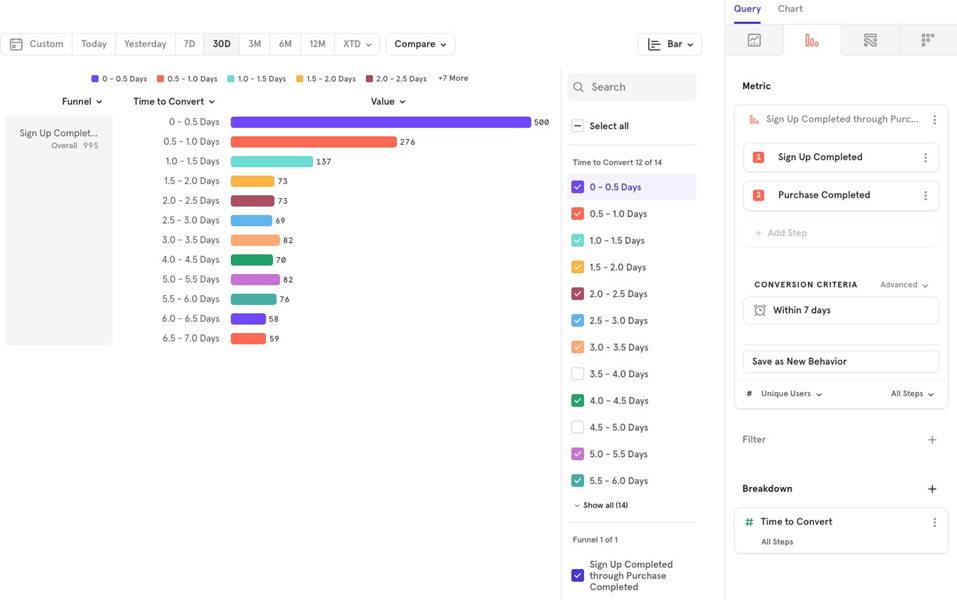
Time to Convert
The Time to Convert property helps you analyze how long it takes for users to move through a funnel and complete a conversion. Itʼs useful for identifying trends in user behavior, such as how quickly or slowly users convert between specific steps.
Example:
You want to see how long it takes for users to go from Sign Up to Purchase Completed. Using the Time to Convert property, you can visualize the time distribution for those who successfully converted.
Here’s how to set it up:
- Change Chart Type: Switch from the default Funnel Steps to a Bar Chart for clearer distribution visualization.
- Change Conversion Criteria: Adjust the criteria from % Conversion to Unique Users to focus on the number of users and how long it took them to convert.

![[Week 27] Learning Mixpanel: Bucket Customisation Types](/content/images/size/w600/2026/02/a81f7bcb-4886-4711-b1b8-af8c5fc6b1b8_463x476.png)
![[Week 26] Learning Mixpanel: Mastering Attribution with Mixpanel](/content/images/size/w600/2026/02/4e3a164c-bfb1-479f-9f09-2f8890eac413_885x787.png)
![[Week 25] Learning Mixpanel: Warehouse Connectors](/content/images/size/w600/2026/02/4cff7069-5e30-4732-9d61-2e24087994f7_968x616.png)