D2C Playbook 2 -- Putting all your data in one place

The short version
On your own website and app, you know who your customer is. You know that Priya came back three times before she bought, that she found you through an Instagram ad, that she abandoned a cart in March and came back in May. That is the layer you set up in Part 1, and it is the layer you own.
The moment you start selling on Blinkit, Swiggy, and Amazon, that knowledge disappears. Those platforms hand you sales numbers, not people. You learn that 47 units of your 250ml bottle sold in Gurgaon last week. You do not learn who bought them, whether any of them bought from you before, or whether they will again. The customer belongs to the platform, not to you.
So when someone promises you "one unified view of your customer across every channel," they are promising something that cannot be built. Not because the tools are immature. Because the data does not exist. What you can build is a single place where all your numbers live honestly side by side, joined where they genuinely connect and kept separate where they don't. That place is a warehouse, and this playbook is about what goes into it and what each channel will actually give you to put there.
Why can't you get one unified view of your customer?
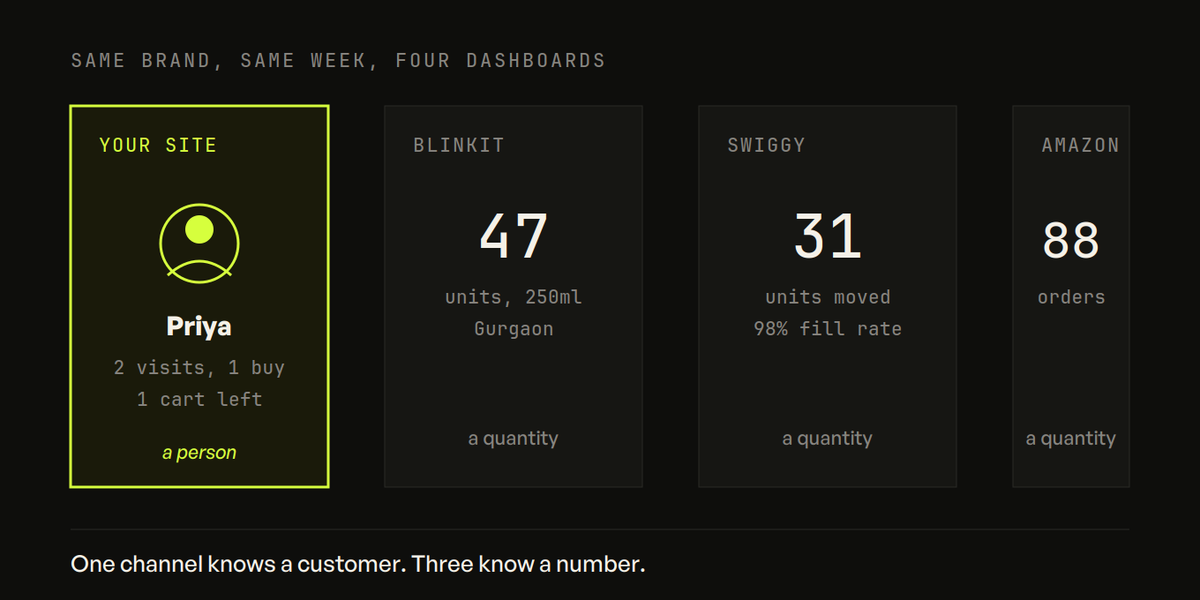
Picture the same brand in the same week, looking at four dashboards.
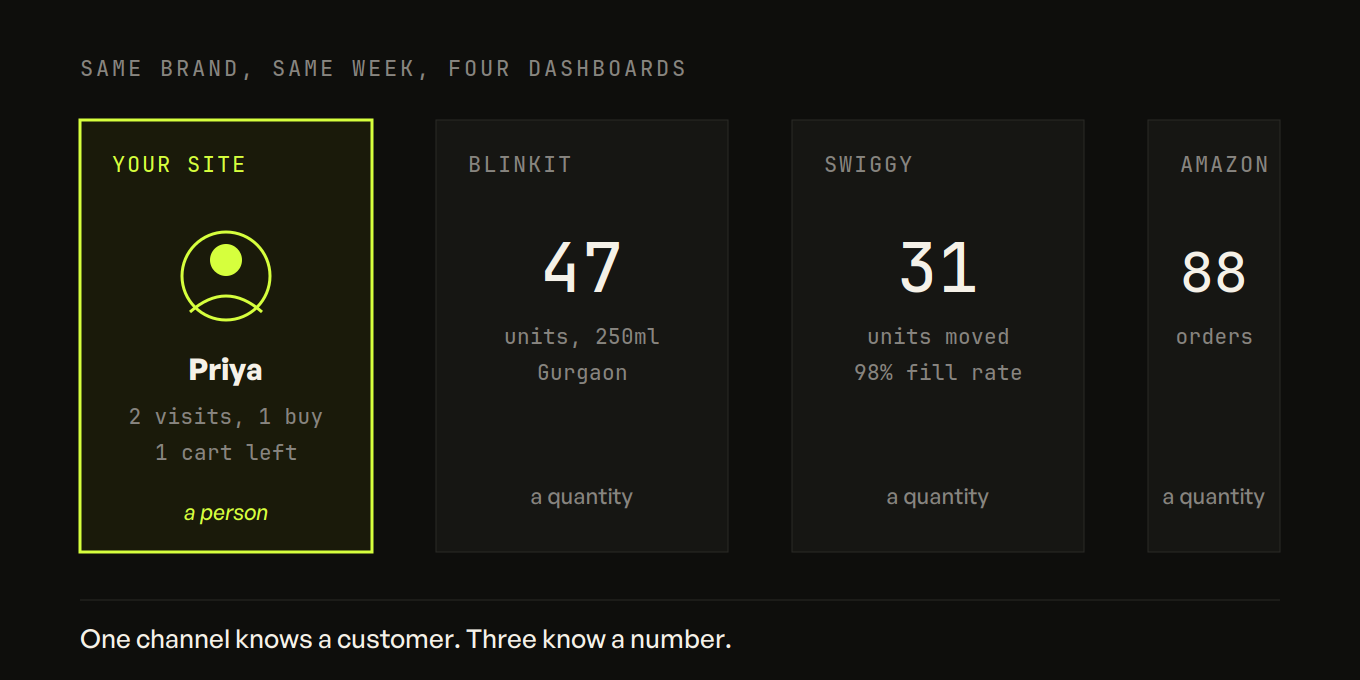
The website dashboard knows Priya. A name, an email, a full history. Two visits, one ad click, one purchase, one earlier cart she didn't finish.
The Blinkit dashboard knows a number. Forty-seven units of one SKU, sold across a handful of Gurgaon pincodes, on Tuesday. No name attached to any of them.
The Swiggy dashboard knows a different number, shaped differently again. Units moved, your fill rate, whether you stayed in stock.
The Amazon dashboard knows orders. Cleaner than the others, exportable through a proper system, but still just orders and aggregate reports. No customer you can reach.
Four dashboards, four units of measurement. One of them is a person. Three of them are quantities. This is the actual problem, and most of the confusion in cross-channel reporting comes from pretending these four things are the same kind of thing and can simply be added together. They can't, and the rest of this playbook is about handling that honestly instead of papering over it.
What data does each channel actually give you?
Before you can put anything in one place, you have to know what each channel actually gives you. They are not even close to equal.
Your own website and app. This is home. You drop in an SDK, you fire events, and you get everything: who the user is, what they did, in what order, where they came from, what they bought. This is the Part 1 layer, the only place you have true customer-level data. If you instrument nothing else well, instrument this, because it covers the biggest part of the business and it is the only part where you own the customer outright.
Amazon. The mature one. Amazon has a real, documented system for getting your data out programmatically, called the Selling Partner API, or SP-API. You can pull orders, payments, inventory, and a set of brand analytics reports on a schedule, automatically, without anyone logging in to download a file. The catch is the same catch as everywhere else off your own property: the reports are aggregated and anonymized. You get sales and traffic and even which products get bought together, but you do not get a customer you can identify or message. Clean export, still no people.
Blinkit. The best data in quick commerce right now, and it isn't close. Blinkit's Brand Central gives you real-time, SKU-level, city-level numbers, and the genuinely remarkable part is the attribution: you can see which keyword drove which sale, in which city, for which product, on the same day. No other ad channel in India shows you that at this price. It is worth being clear-eyed about why Blinkit gives you this, though. The listing fee is ₹25,000 per SKU per state, returned to you as ad-wallet credit that expires in twelve months. That is not a shelf-rental cost, it is a media buy, and the rich data is what they are selling you alongside the placement. Excellent numbers. Still aggregated. Still no customer identity you can take with you.
Swiggy Instamart. The weakest of the group analytically. Its brand reporting leans operational, things like catalog health, whether you stayed in stock, your fill rate, rather than the sharp sales-and-attribution view Blinkit gives you. Plenty of brands end up filling the gap with third-party tools that scrape Instamart for pricing and availability. Useful for keeping an eye on the shelf, but it tells you even less about who is buying than the others do.
Zepto. Two tiers. The free Brand Portal covers basic day-to-day performance. The paid tier, Zepto Atom, is genuinely capable: PIN-code-level performance maps, minute-by-minute sales, an AI assistant you can ask questions in plain English, and, notably, metrics labelled "retention" and "repeat purchase." It runs ₹30,000 or 0.5% of your sales on Zepto, whichever is higher, for a 90-day stretch.
That word "retention" deserves a pause, because it is exactly the trap this playbook exists to point out. When Atom tells you your repeat rate, it is computing that inside Zepto, from data Zepto holds, and showing you the answer. What it is not doing is handing you the list of customers so you can see whether those same people also buy from you on your website, or on Blinkit. You get the number. You do not get the identities behind it. The retention is real, but it is locked on Zepto's side of the wall, which means it tells you how you are doing on Zepto and nothing about the same shopper anywhere else.
What can you join, and what can you only estimate?
Here is the distinction that separates a setup you can trust from one that quietly lies to you. Some things across these channels genuinely connect. Others can only be guessed at. The whole game is knowing which is which and never confusing them.
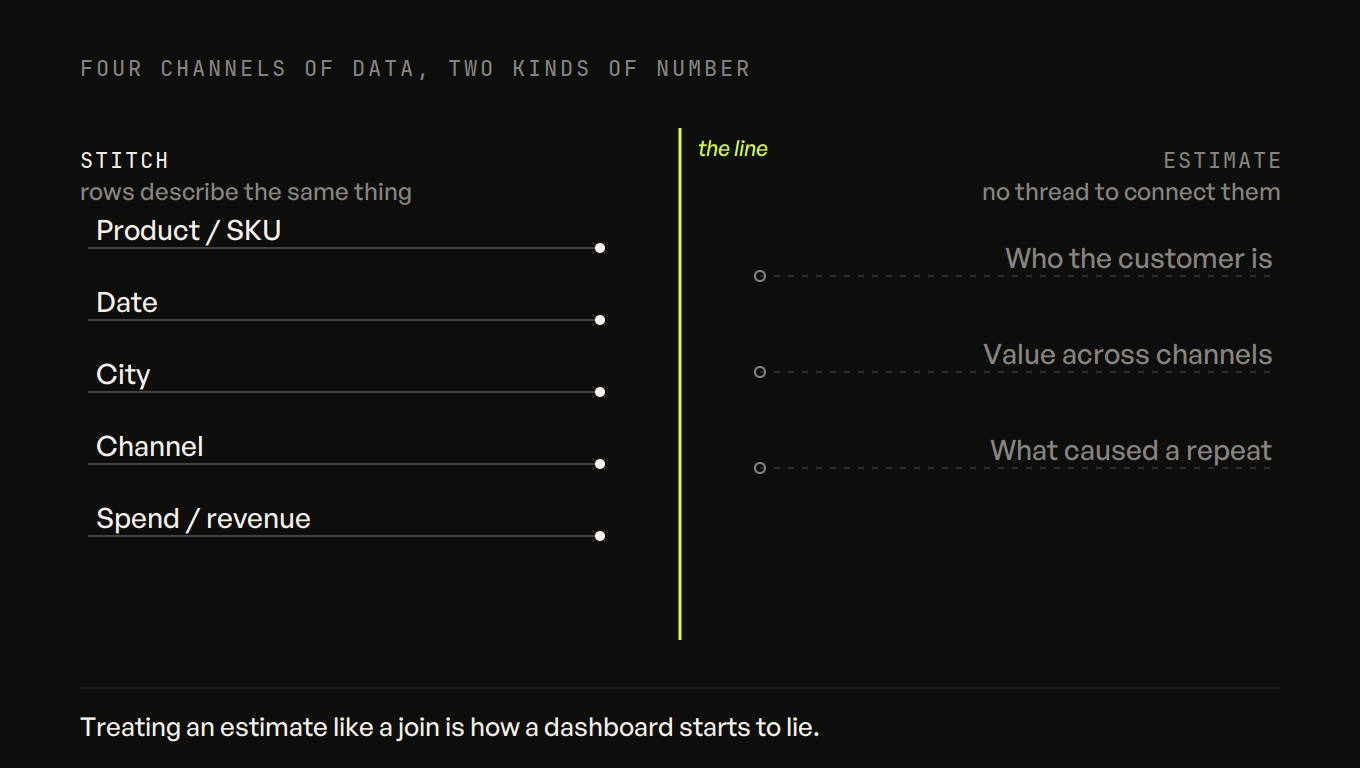
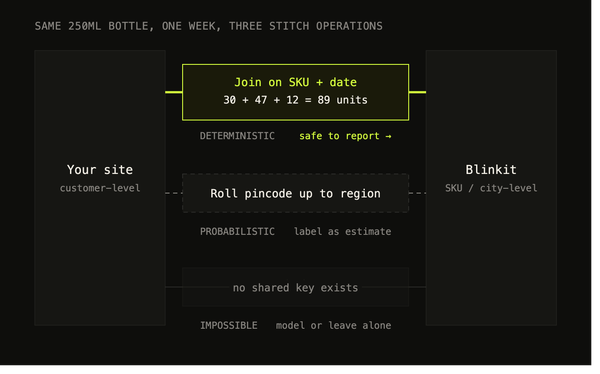
On one side are the things you can actually join, because they describe the same thing in a way that lines up. A SKU is a SKU. The 250ml bottle on your website is the same 250ml bottle on Blinkit and on Amazon. A date is a date. A city is a city. Revenue is revenue, and ad spend is ad spend. When you line your channels up by product, by day, by city, by money in and money out, the rows match because they are describing the same underlying reality. This is real stitching. You can say, with confidence, "this SKU did ₹4 lakh across all channels last month, growing fastest in Bangalore, and here's what we spent to get there." Every piece of that is solid.
On the other side are the things you can only estimate, because the data you would need to know them for certain does not exist. Whether the person who bought you on Blinkit is the same person who bought you on your website. What a customer is truly worth across every channel they touch. Which channel actually caused a repeat purchase. These all require connecting one anonymous sale to another, and the platforms gave you no thread to do it with. You can model it. You can make educated assumptions and produce a number. But that number has error bars, and it is a different kind of number from "this SKU did ₹4 lakh."
The mistake that wrecks cross-channel reporting is treating an estimate like a join. A dashboard that confidently shows you "total customers across all channels" or "blended LTV" has, somewhere underneath, quietly guessed, and then presented the guess with the same certainty as a hard number. It looks more complete. It is actually less trustworthy, because you can no longer tell which figures you can bet on and which you can't. An honest setup keeps the two sides visibly apart. It shows you the joined numbers as fact and the estimated numbers as estimates, clearly labelled, so you always know how much weight a figure can hold. That honesty is not a limitation to apologize for. It is the entire value.
Where should all this data land? One warehouse, three grains
So if you can't pour everything into one tidy table of customers, what do you actually build? You build a warehouse. And the warehouse holds your data at three different levels of detail, kept honest, joined only where the join is real.
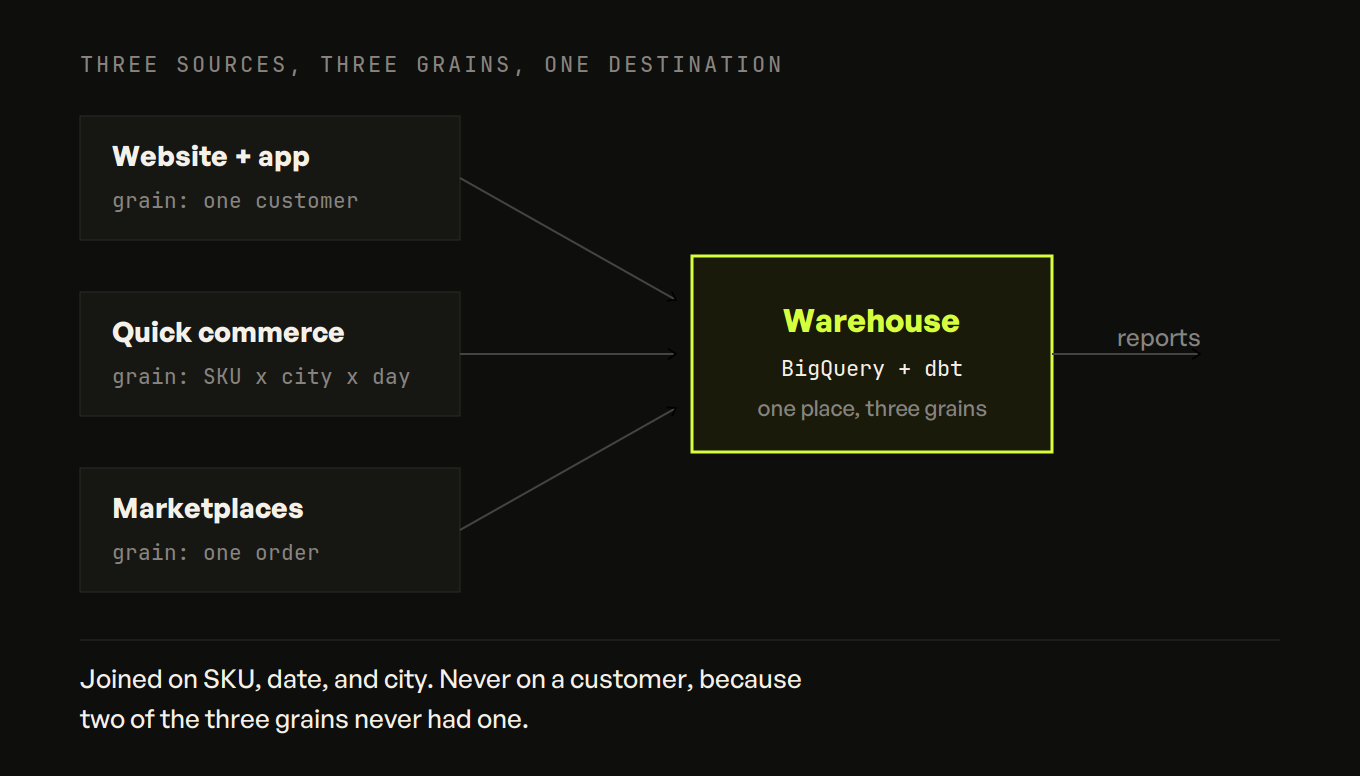
A warehouse, in plain terms, is one database that everything flows into, so that all your numbers live in a single place instead of scattered across five portals you have to log into separately. For most D2C brands the practical choice is Google BigQuery: it is cheap until you are large, it handles messy data from many sources, and the whole Indian D2C tooling ecosystem already plugs into it. On top of the raw data you run a transformation layer, usually a tool called dbt, which takes the raw, differently-shaped exports from each channel and reshapes them into clean, consistent tables you can actually report on. Raw data goes in, tidy tables come out, and dbt is the step in between.
Inside that warehouse, your data sits at three grains. Think of a grain as the level of detail one row represents.
The first grain is customer-level, and it comes from your own website and app. One row can be one person, with their full history. This is the Part 1 data, and it is the only grain where a row is a human being you can identify and reach.
The second grain is SKU-and-city-level, and it comes from quick commerce. One row is a product in a place on a day: the 250ml bottle, in Gurgaon, on Tuesday, 47 units. No person in the row, because there was never a person in the data.
The third grain is order-level, and it comes from the marketplaces, mainly Amazon through SP-API. One row is an order or an aggregated report. More structured than the quick commerce sell-out files, still no identifiable customer attached.
The reason to keep three grains instead of forcing everything into one is that they genuinely are three different things, and pretending otherwise is how you end up with numbers that quietly lie. You join them where they legitimately connect, on SKU, on date, on city, on channel, and you leave them separate where they don't, which is anywhere a customer's identity would be required. The result is a single source of truth in the only sense that phrase can honestly mean: one place, all the numbers, each at the level of detail the data actually supports.
Getting the data into the warehouse is the unglamorous part, and it is worth being honest that it is uneven. Amazon, through SP-API, can be automated properly: set it up once and the data flows on a schedule. For Blinkit, Swiggy, and Zepto, there is no equivalent open pipe, so in practice you are exporting CSVs from each brand portal, or paying for a third-party connector that does the fetching for you, or in some setups stitching together scraped feeds. It is more manual than anyone would like, and it breaks more often than Amazon's does. But the destination is the same regardless of how cleanly each source gets there: every channel's numbers, in one warehouse, at the grain the data supports, ready to actually answer questions.
What should you do Monday?
Start by deleting the phrase "unified customer view" from your plan, because chasing it means chasing data that does not exist, and you will either waste months or pay someone for a number that is secretly a guess. Aim instead for "one place, honest grains," which is both buildable and enough.
Stand up the warehouse first. BigQuery, with dbt on top to clean things up. That is the destination everything else feeds into, and it is worth having before you start connecting sources.
Connect Amazon first, because SP-API is the only clean automated pipe you have, and getting your most structured channel flowing properly gives you an early win and a template. For Blinkit, Swiggy, and Zepto, accept manual exports or a connector for now. The data is good once it lands; it is just more work to land it, and that is fine as a starting point.
Then, before you build a single dashboard, write down the questions you actually need answered, because the three grains decide which questions are even askable. Channel revenue and SKU velocity by city are stitch-able, so you can answer those cleanly. True cross-channel customer LTV is an estimate at best, so treat any number you produce for it as directional and label it that way. Knowing in advance which of your questions has a solid answer and which has only an approximate one will save you from trusting a figure that can't hold the weight you put on it.
You now own your own turf, and you have an honest single view of everything else stacked beside it. The next problem is that even the numbers you trust most, the ones coming off your own website, are not always telling you what you think they are. That is Part 3, the metrics that lie.
Frequently asked questions
Can you build a single unified customer view across website, Blinkit, Swiggy and Amazon?
No, and not because your setup is bad. Quick commerce and marketplace platforms hand you sales numbers, not people. Your website knows Priya — name, email, full history. The Blinkit dashboard knows that 47 units moved across a handful of Gurgaon pincodes on Tuesday. There is no identifier that joins those two.
What can you actually join across channels?
Things that describe the same object in a way that lines up. A SKU is a SKU — the 250ml bottle on your site is the same 250ml bottle on Blinkit. Time and geography join too. What you cannot join is whether the person who saw your ad is the person who bought on a marketplace; that data doesn't exist, so it can only be estimated.
What is a data warehouse, in plain terms?
One database everything flows into, so your numbers live in a single place instead of scattered across four dashboards. For D2C, BigQuery with dbt on top to clean things up is the sensible default.
What are the three grains?
The level of detail one row represents. Your data lands at three of them rather than one flat customer table — which is the honest structure, given that some channels give you people and others only give you aggregates.
Which channel should you connect first?
Amazon. SP-API is the only clean, documented, automated pipe you have, so getting your most structured channel flowing properly gives you an early win and a working pattern for the rest.
What should you stop doing?
Delete the phrase "unified customer view" from your plan. Chasing it means chasing data that does not exist, and you will either waste months or buy a tool that quietly fakes it.