D2C Playbook 6 -- Incrementality Testing
Every ad platform you pay is graded on a test it writes, marks, and reports itself. Meta decides which sales to claim credit for, then hands you a ROAS built on that claim.

The short version
Every ad platform you pay is graded on a test it writes, marks, and reports itself. Meta decides which sales to claim credit for, then hands you a ROAS built on that claim.
The number is not a lie exactly. It is just answering a question you did not ask. It tells you how many buyers touched a Meta ad on the way to checkout. It does not tell you how many of them would have bought anyway.
That second number is the only one that decides whether your spend is working. It is called incremental revenue, and it never shows up on any dashboard, because no platform can see the version of reality where it did not run your ad.
Incrementality testing is how you measure that missing number yourself. For most Indian D2C brands it is not a data science project. It is a geo holdout: turn ads off in a few matched cities, keep them on in others, and read the gap.
A channel that reports 4.0x can be sitting at 1.7x once you account for the sales that were coming regardless. This playbook shows you how to prove it.
What does incrementality look like on a real brand?
Here is a real-shaped example.
A D2C skincare brand, roughly ₹2 crore a month in revenue, spending on Meta like everyone else. They ran a geo holdout for four weeks. Same product, same creative, same season. In one set of cities Meta ads stayed on. In a matched set, they went dark.
Two numbers came out of it, and they told opposite stories:
- Reported ROAS: 4.0x. What Meta's dashboard claimed the campaigns drove.
- Real, incremental ROAS: 1.7x. What the holdout actually proved.
Same spend, same weeks. One number says pour in more money. The other says you are barely breaking even. The rest of this playbook is how you get from the first number to the second.
What is incrementality testing?
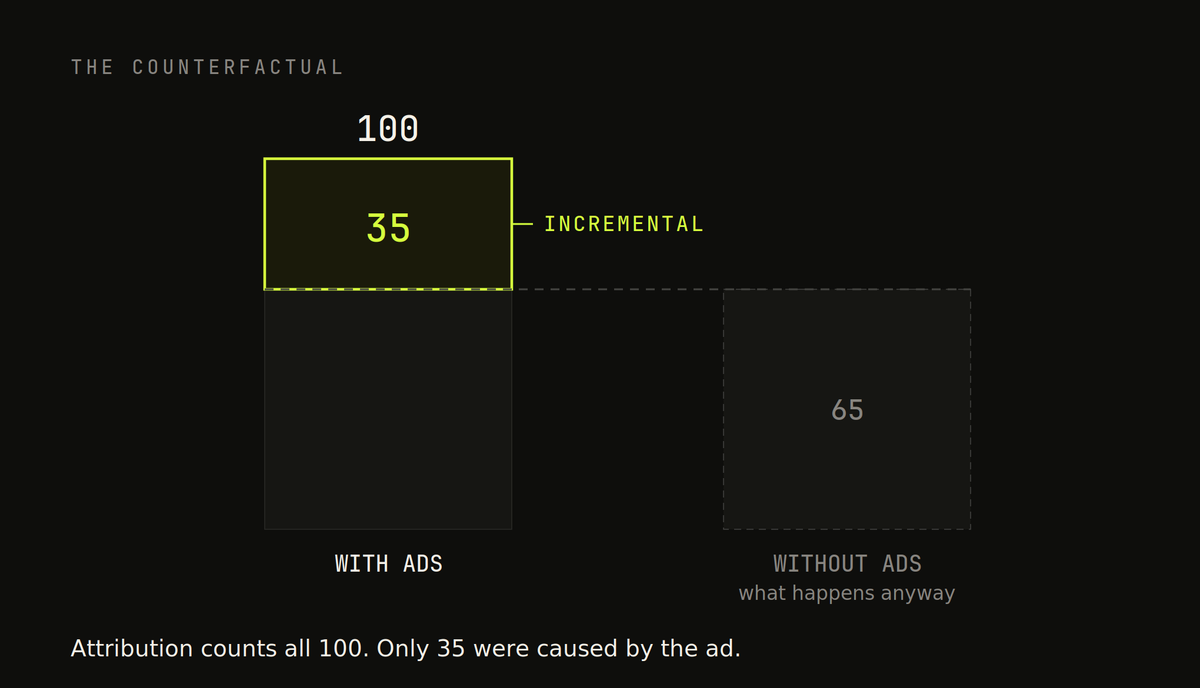
Incrementality is the sales your advertising caused that would not have happened otherwise. Nothing more complicated than that.
The hard part is the counterfactual: the parallel version of the same four weeks where you never ran the ad. You cannot observe it directly. Every measurement method is just a different way of estimating it.
Attribution does not estimate it at all. It watches who touched an ad and assigns them credit.
So if someone was already going to buy your face serum, already had it in cart, already typed your brand name into Google, and then happened to pass a Meta ad on the way, attribution hands Meta the sale. The ad was present. It was not necessarily the cause. Presence and cause look identical on a dashboard, and they are completely different on a P&L.
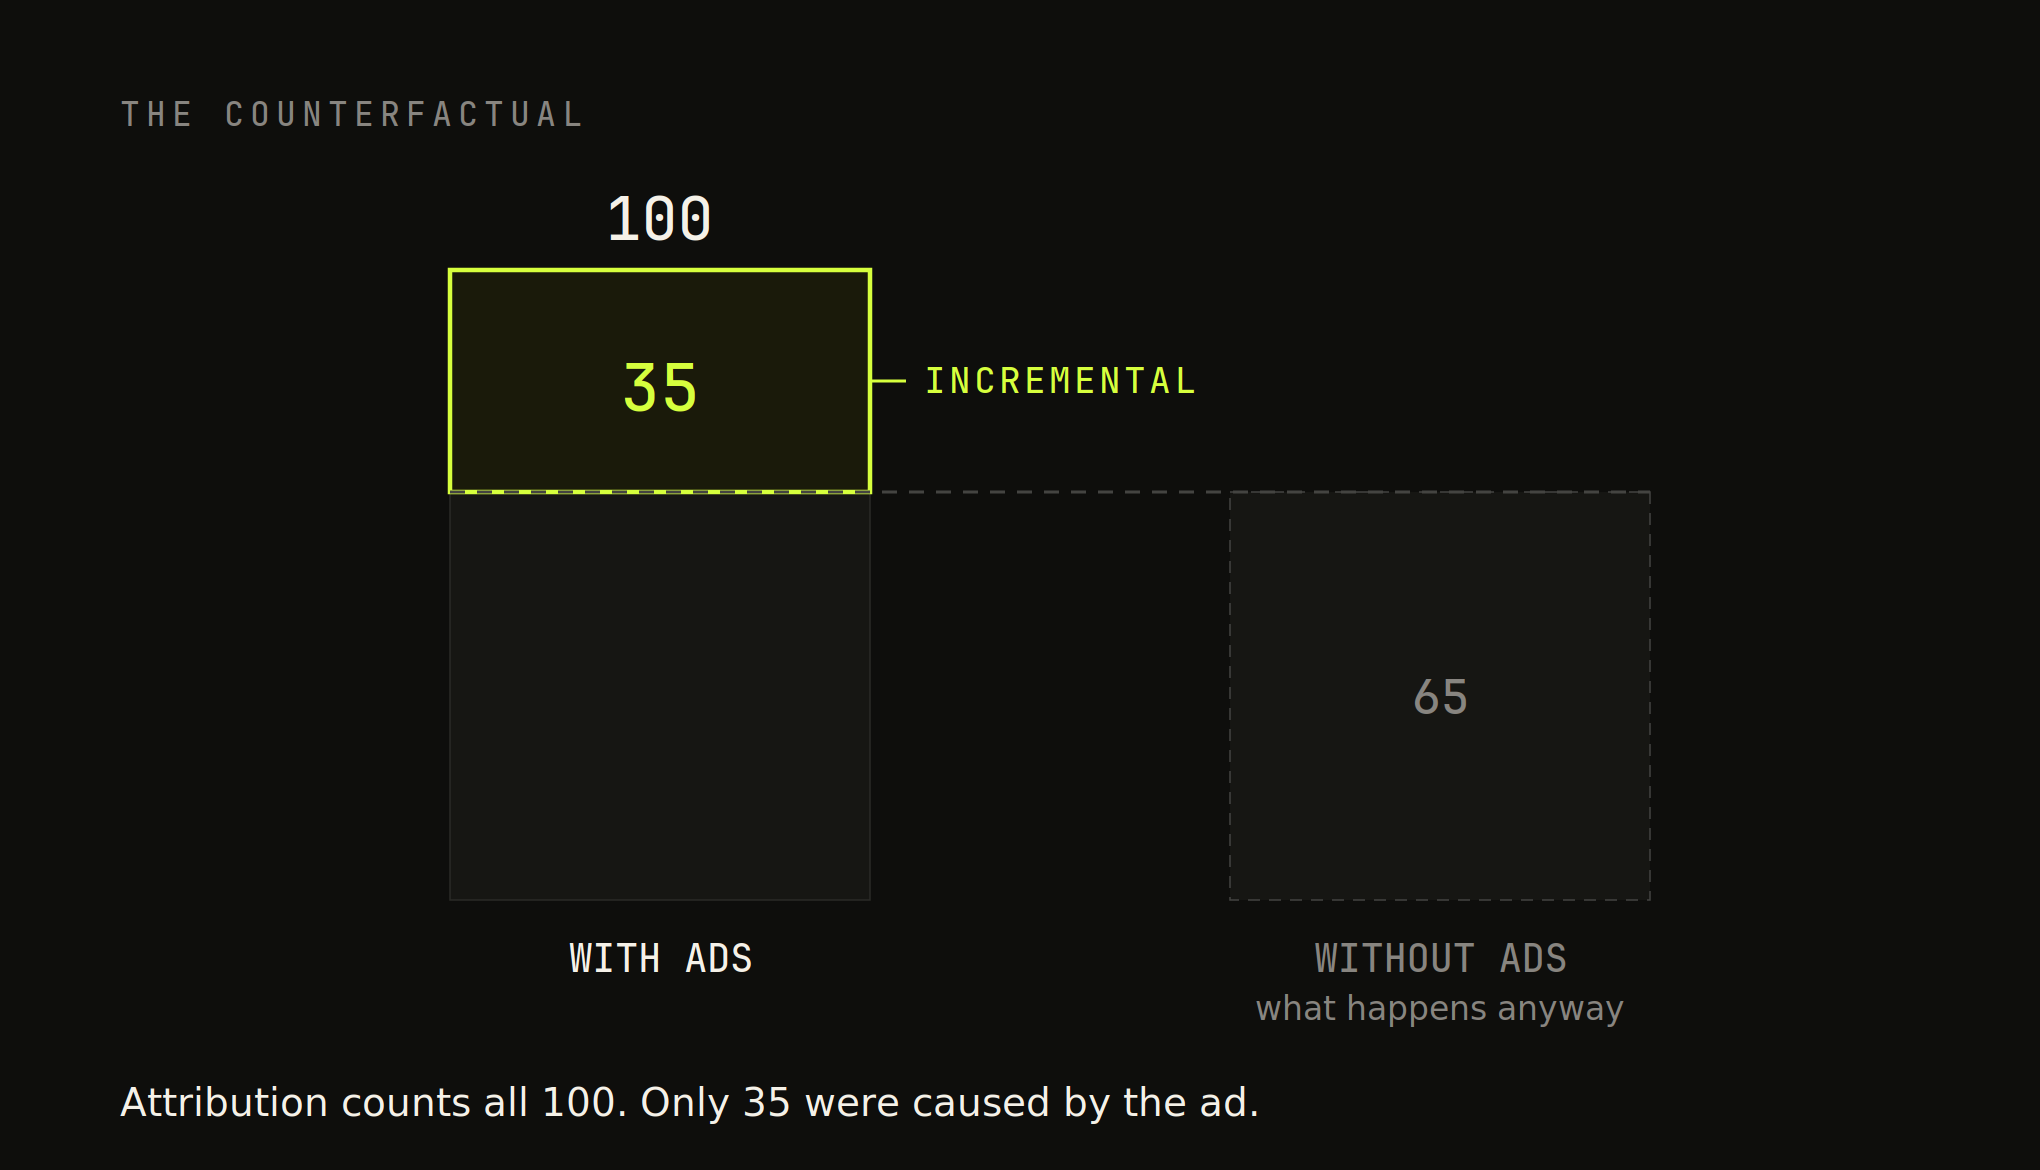
When you show ads to people who already visited your site, added to cart, or bought before, you are advertising to the users most likely to come back on their own. Attribution loves these campaigns because the conversion rates look incredible. Incrementality is often where they look worst, because you are paying to reach people who were already on their way.
This is not a hunch. The cleanest evidence in the field is an experiment Blake, Nosko and Tadelis ran with eBay, published in Econometrica. eBay switched off paid search in 68 US markets. If those ads were driving sales, sales should have dropped there. They did not move in a way you could distinguish from zero, because when the paid links disappeared the traffic simply arrived through free organic search instead.
The honest caveat matters here, because it is the whole point of measuring instead of assuming. That result is not a universal law:
- For branded keywords, the ads were paying to intercept demand that was already eBay's. Near-zero incremental value.
- For non-brand keywords, the same study found real lift on new and infrequent buyers, the people who genuinely needed a nudge.
- When researchers repeated the experiment at Edmunds.com, a less famous brand, paid search turned out to be far more incremental, because Edmunds did not already own the demand.
So the lesson is not "ads do not work," or even "retargeting is always waste." Incremental value is specific to your brand, your channel, and your audience. The only way to know yours is to run the test.
How does a geo holdout test work, end to end?
A geo holdout works because you cannot split one buyer into two universes, but you can split your country into two.
Pick cities where ads keep running. Pick comparable cities where they stop. Let the cities that went dark stand in for the counterfactual. The cities with no ads tell you what would have happened without them. The cities with ads tell you what actually happened. The gap is incremental.
Back to the skincare brand. Here is the whole test in numbers.
They chose eight cities and split them into two groups of four, matched so each group had been doing about the same revenue before the test. Call it a ₹30L baseline for each group over a four-week window.
That matching is the load-bearing step. If the two groups do not behave alike before you touch anything, nothing after is trustworthy.
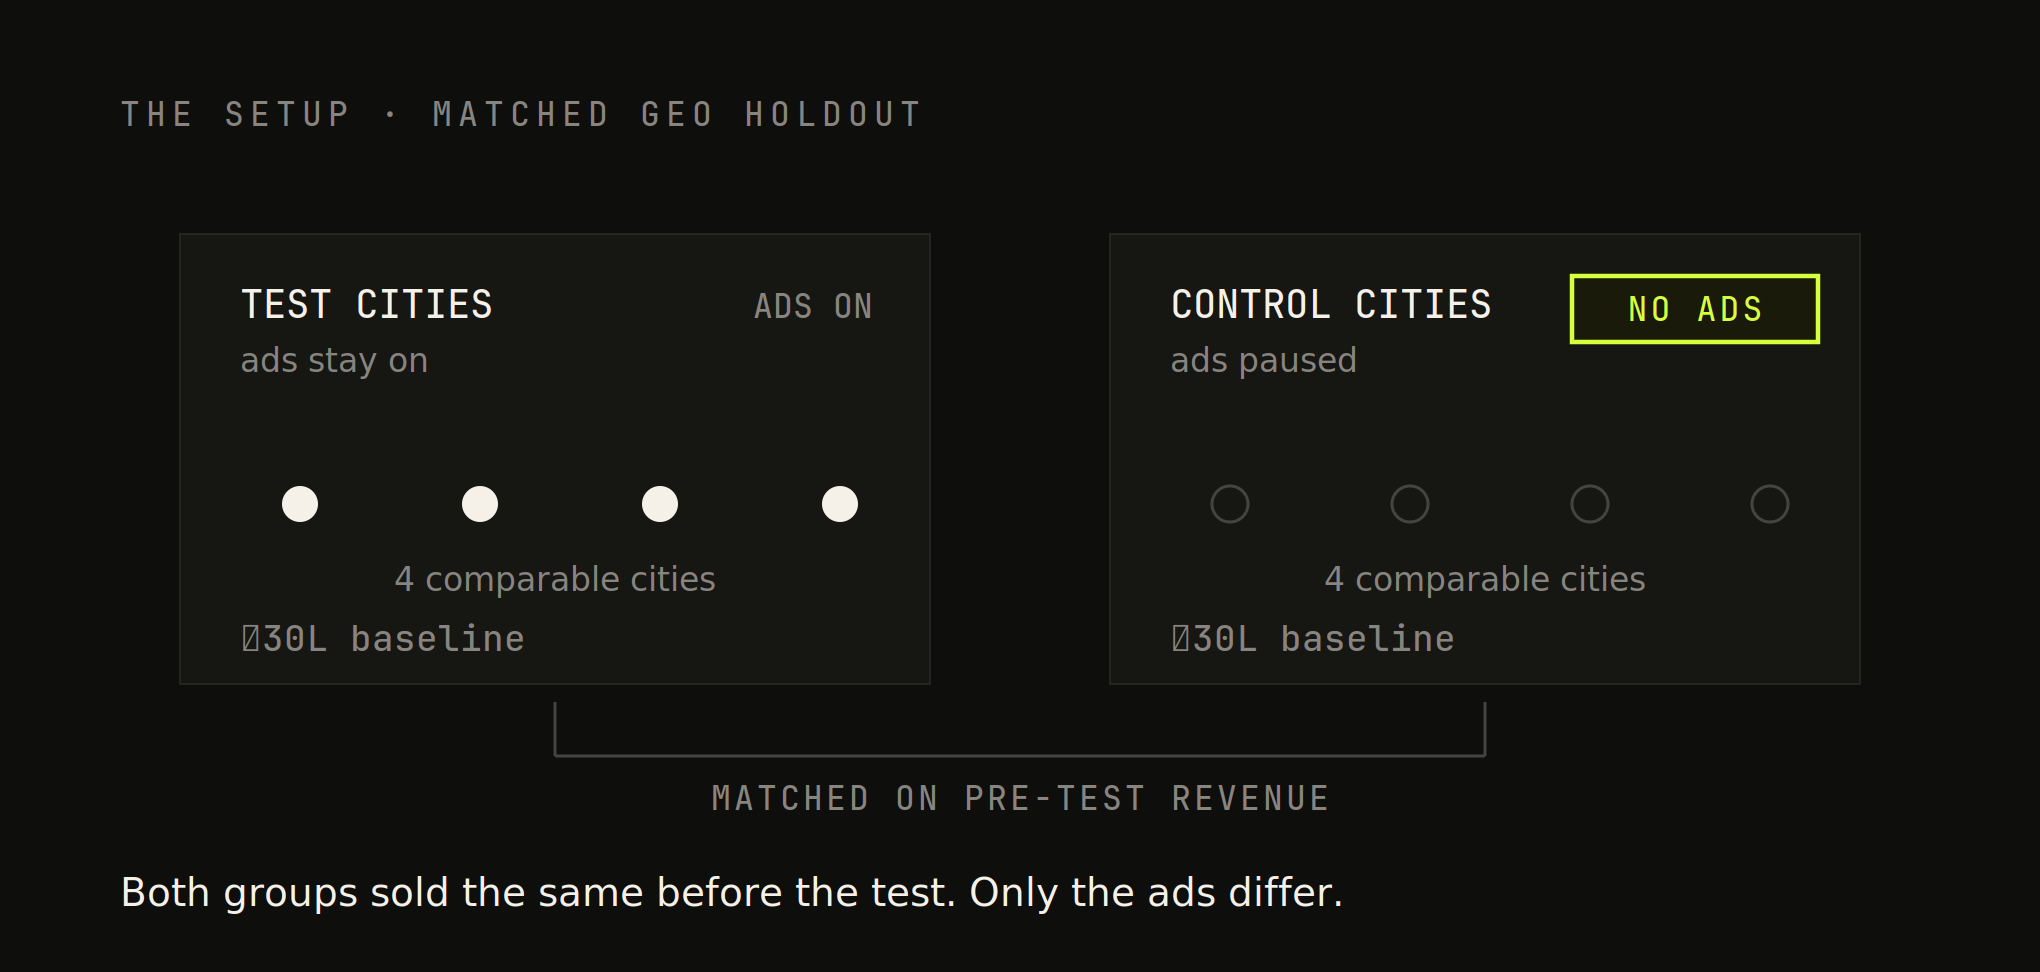
For four weeks, the test cities kept running Meta ads and the control cities ran none.
- Spend in the test cities over that window: ₹10L.
- Revenue Meta's dashboard reported those campaigns drove: ₹40L.
On its own, that reported number looks like a 4.0x machine you would be stupid not to feed.
Reported ROAS = revenue Meta claims ÷ ad spend
              = ₹40L ÷ ₹10L
              = 4.0x
Now the holdout. When the four weeks ended:
- Control cities (no ads) had done ₹30L, exactly their baseline. That is your counterfactual made visible. With no Meta ads at all, these comparable cities still generated ₹30L.
- Test cities (ads on) had done ₹47L.
The incremental revenue is the difference between what the advertised cities actually did and what the un-advertised cities tell you they would have done anyway.
Incremental revenue = test-city revenue − control-city revenue (would have happened anyway)
                    = ₹47L − ₹30L
                    = ₹17L
A quick note on matching. If your two groups are not perfectly matched on baseline, scale the control to the test's size before comparing, so you are not punished or rewarded for one group simply being bigger:
Expected revenue without ads = control revenue × (test baseline ÷ control baseline)
Here the baselines matched, so the expected figure is just the ₹30L the control cities produced.
Now the number that actually matters, the return on the money that did real work:
Incremental ROAS (iROAS) = incremental revenue ÷ ad spend
                         = ₹17L ÷ ₹10L
                         = 1.7x
And the lift, the honest measure of how much the ads changed the outcome:
Lift % = incremental revenue ÷ baseline revenue
       = ₹17L ÷ ₹30L
       ≈ 57%
So the ads were not worthless. They genuinely added ₹17L the brand would not otherwise have earned, a 57% lift over the no-ad baseline.
But Meta claimed ₹40L. The gap between ₹40L claimed and ₹17L real, more than half of what Meta took credit for, is revenue that was coming regardless. The platform counted the sales that walked past its ad and called them conversions.
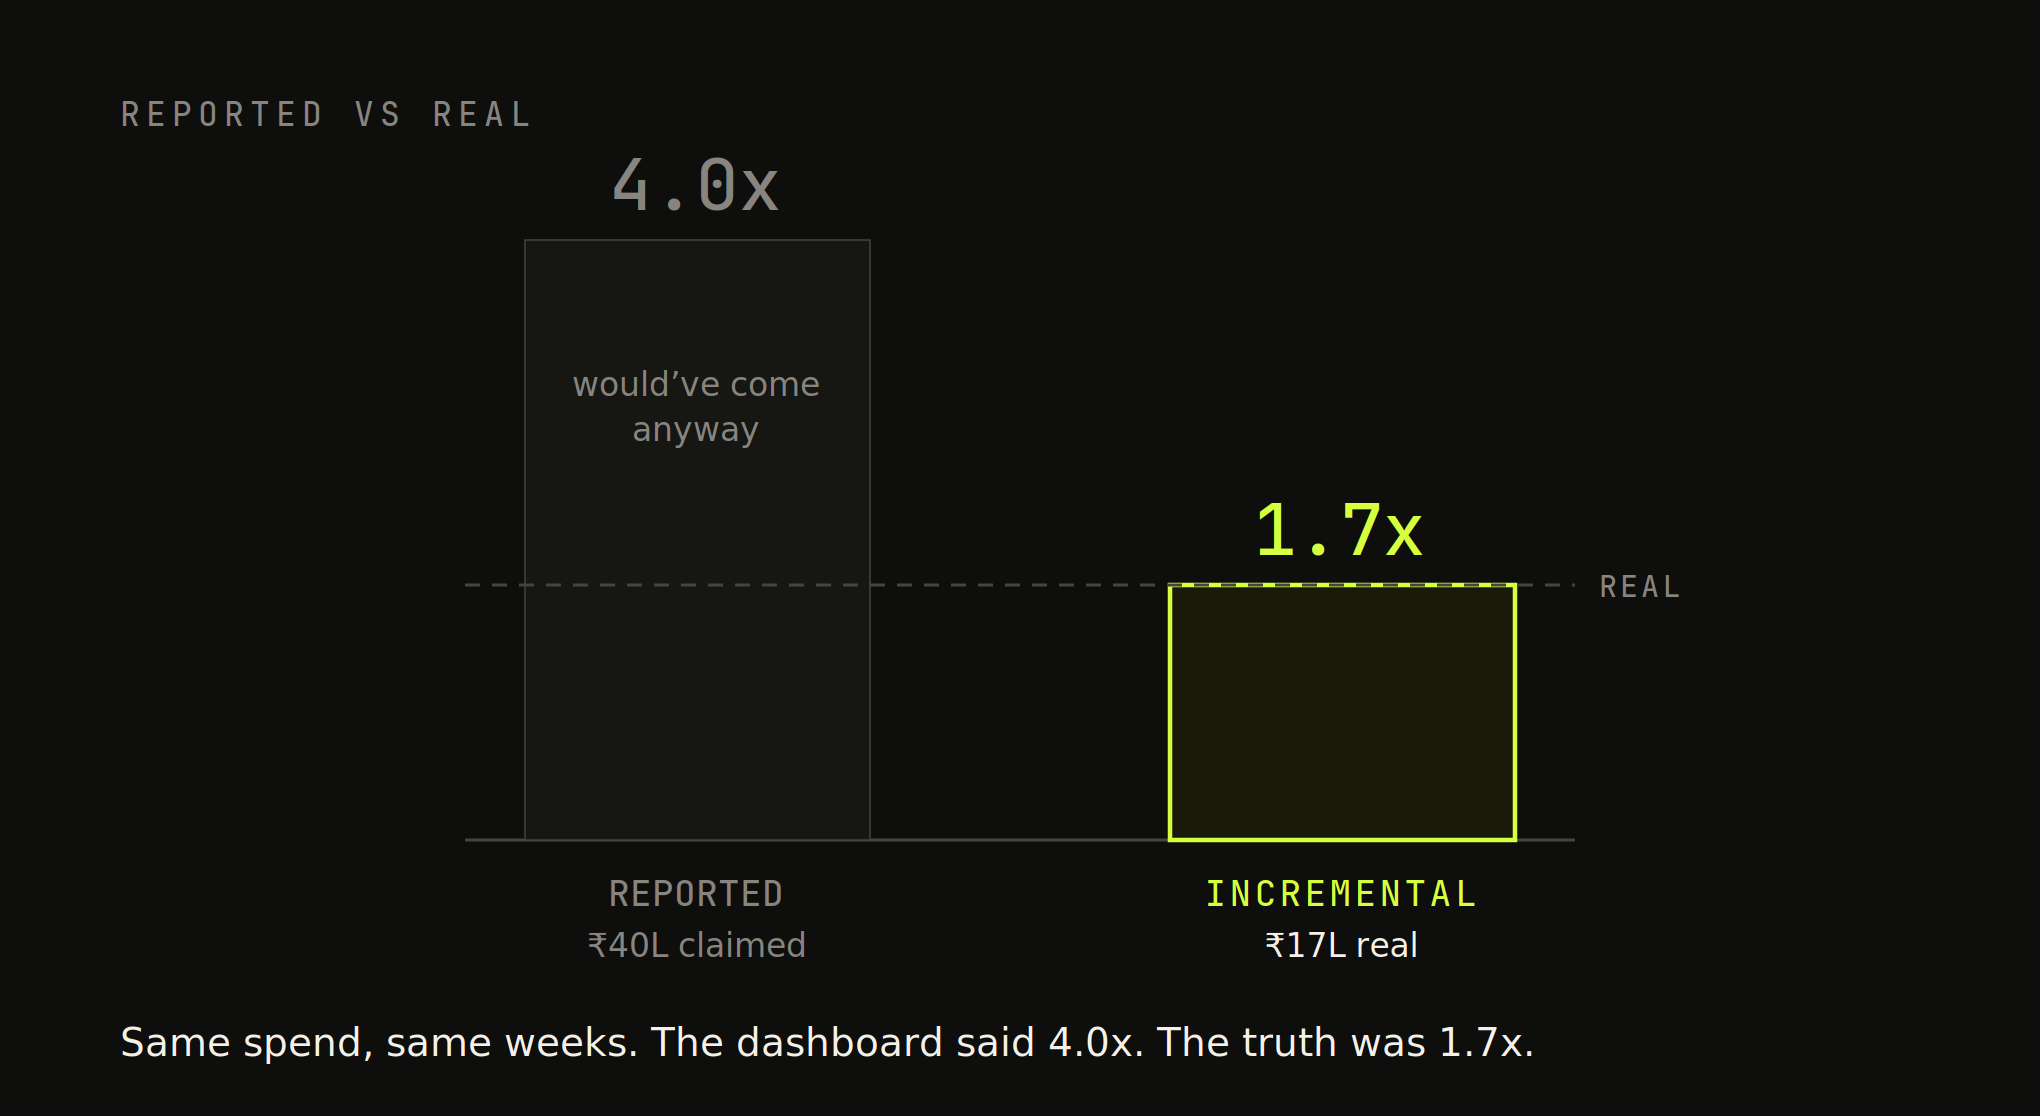
Here is where it stops being a measurement exercise and becomes a decision.
A 4.0x channel is a money printer. You scale it without thinking. A 1.7x channel is a judgment call, and the judgment depends entirely on your margins.
Say this brand runs a 60% contribution margin:
- ₹17L of incremental revenue is worth about ₹10.2L in gross profit.
- They spent ₹10L to earn it.
- That is roughly break-even.
The channel that looked like it returned four rupees for every one was, in truth, barely paying for itself.
That single fact changes what you do next. On the reported number you double the budget. On the real number you hold spend flat, dig into which cities and audiences actually drove the ₹17L, and cut the retargeting that was inflating the dashboard. The test did not just correct a number. It reversed the decision.
How do you actually run an incrementality test?
Before the methods, the reality most guides skip.
The advice you will read everywhere is "just use Meta's built-in Conversion Lift." For a large advertiser that is fine. For most Seed to Series C D2C brands it quietly does not apply.
Meta's Conversion Lift is a proper randomized holdout. It holds out a slice of users who are eligible for your ads but never served them, and it works well. It also carries real minimums:
- The spend threshold people cite is around ₹25 to ₹30 lakh over a four to six week study.
- You need enough conversions, roughly ten thousand-plus events in the window, before the result is meaningful rather than noise.
- Google's equivalent is harder still. Its Conversion Lift generally needs a Google rep to switch on and runs at the account level, so every campaign gets pulled into the test.
So for a brand spending ₹10L a month across everything, the native lift tools are not a fallback option. They are often out of reach.
The DIY geo holdout is not the poor cousin of the "real" method. It is frequently the only rigorous method you can actually run. Here is the honest menu.
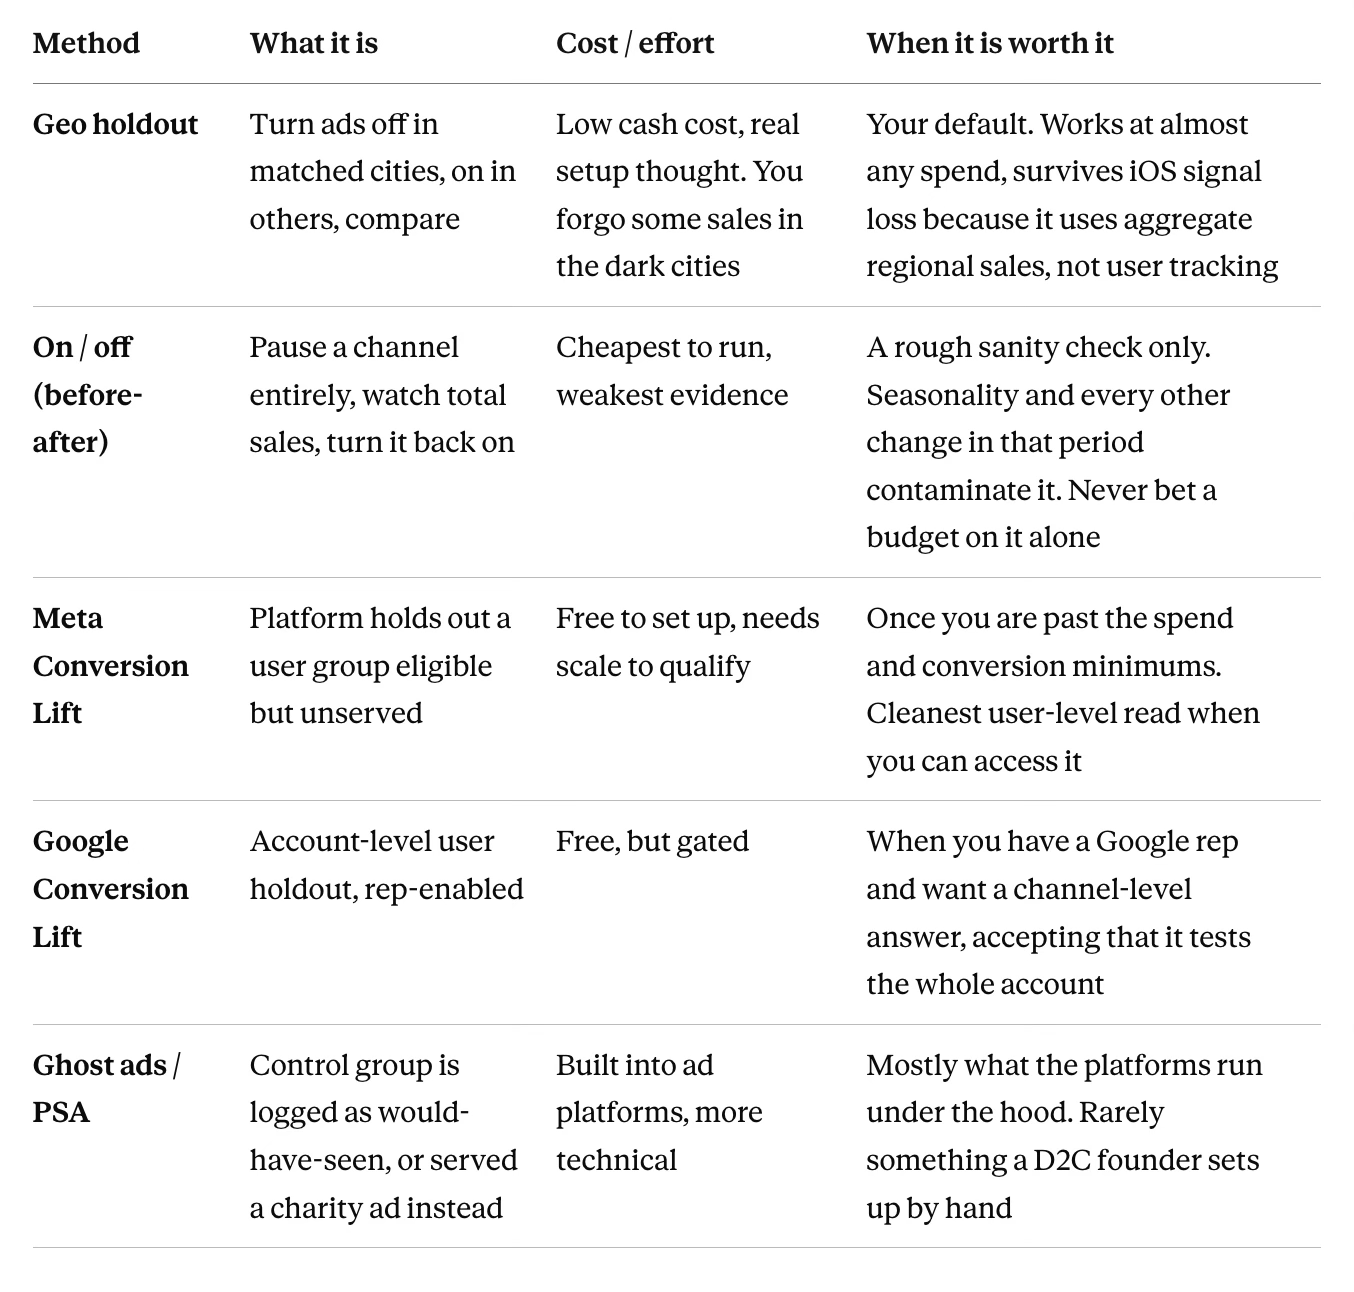
Two practical notes:
- The platform tools measure rates, not revenue. Meta shows purchase rate in the exposed group against the held-out group, say 1.0% versus 0.8%, and the gap is your lift. Same idea as the geo test, just measured on people instead of places.
- There is a free tool for the proper geo version. Meta publishes GeoLift, an R library that uses synthetic control methods to pick your test markets and construct the counterfactual, and Google has similar tooling in Market Matching and GeoX.
What makes an incrementality test lie?
A badly run test is worse than no test, because it launders a wrong answer as a measured one. These are the ways a geo holdout quietly breaks.
- Contamination. If your dark cities are not actually dark, the test is dead. Retargeting audiences, national lookalikes, an email blast, a WhatsApp campaign, or a nationwide influencer can all reach the people you thought you were holding out, and the gap you measure shrinks toward nothing. Before you trust a holdout, confirm nothing else is quietly serving the control cities.
- Too short a window. Your ads have a delay between click and purchase, and lingering effects after a campaign runs. Cut the test off after a week and you miss both. Four weeks is a reasonable floor for most D2C, longer if your purchase cycle is slow.
- Seasonality and outside shocks. Run your test across a sale, a festival, a competitor stocking out, or a supply problem that hits one region and not another, and you measure the event, not the ads. Matched cities protect you from anything that hits both groups equally. They do not protect you from something that hits one group alone.
- Too few or too small geos. Two cities against two cities is not a test, it is an anecdote. City-level revenue bounces around week to week, and with a handful of markets that noise can swamp the ad effect entirely. You can run a geo test, see no lift, and wrongly conclude your ads do nothing, when the truth is your test never had the power to detect the lift that was there. If you are running the simple version by hand, more matched cities on each side is the safest lever you have.
None of these are exotic. They are the everyday reasons a clean-looking test produces a confident wrong number. Every one of them is avoidable if you check for it before you launch, rather than after you have already moved a budget on bad data.
What should you do Monday?
You do not need a measurement platform or a data team to start. You need one channel you are suspicious of, usually the one with a suspiciously high ROAS, and the nerve to turn it off somewhere.
- Pick your most-doubted channel. Likely Meta retargeting or branded search.
- Choose six to eight comparable cities that behave alike and have been doing similar revenue.
- Split them into two matched groups.
- Run it for four weeks. Keep the channel live in one group, pause it entirely in the other. Make sure nothing else, no email, no WhatsApp, no lookalike, is quietly reaching the paused cities.
- Do the math. Incremental revenue is test-city sales minus control-city sales. iROAS is that divided by spend. Then check it against your margin to see if the channel actually pays.
- Compare to what the platform reported for those same cities. The size of that gap is the size of the story your dashboard was telling you.
Start with the channel you least believe. That is where the gap between reported and real is usually widest, and where one test can save you the most wasted spend.
Next: part 12, MMM. Turning "which channels are real" into "how the whole budget should be split."
Frequently asked questions
What is incrementality testing?
Measuring the sales your advertising caused that would not have happened otherwise. Nothing more complicated than that. The hard part is the counterfactual — the parallel version of the same four weeks where you never ran the ad — which you can't observe directly, so every method estimates it.
How is incrementality different from attribution?
Attribution doesn't estimate incrementality at all. It watches who touched an ad on the way to checkout and assigns them credit. That tells you how many buyers saw your ad, not how many bought because of it. Only the second number decides whether your spend is working.
Why can't I trust platform-reported ROAS?
Because every ad platform you pay is graded on a test it writes, marks and reports itself. Meta decides which sales to claim, then hands you a ROAS. It isn't a lie exactly — it's answering a question you didn't ask.
What is a geo holdout?
You turn off spend in a set of geographies, keep it running in comparable ones, and compare. Same product, same period, the only difference being the ads. It's the most practical incrementality test for a D2C brand, and it's how the skincare brand in this post found their reported and incremental numbers told opposite stories.
How long should an incrementality test run?
Long enough to cover your purchase cycle and clear the noise — the example here ran four weeks. Too short and you're measuring randomness; too long and market conditions drift underneath you.
What makes an incrementality test give the wrong answer?
Mismatched test and control geographies, a window shorter than your purchase cycle, spillover between regions, and anything else that changed at the same time as the ads. If you can't hold everything else steady, you're measuring that instead.