D2C Playbook 5 -- How to actually stitch website, Blinkit and Swiggy data
By now you have accepted the hard part. Your own site knows your customer. Blinkit, Swiggy and Amazon know a SKU and a sales number, never a person. Stitching sounds like one job. It is really three, and they are not equally trustworthy.

The short version
By now you have accepted the hard part. Your own site knows your customer. Blinkit, Swiggy and Amazon know a SKU and a sales number, never a person.
Part 2 of this series drew that line and pointed you at a warehouse to hold it all. This playbook is the part nobody writes: once the data is landing, how do you actually stitch it together.
Stitching sounds like one job. It is really three, and they are not equally trustworthy.
- Some joins are clean, keyed on fields that mean the same thing on both sides.
- Some are fuzzy, close enough to be useful but wrong at the edges.
- Some cannot be made at all, no matter how much you want them.
The whole skill is knowing which is which, and never letting a fuzzy join sit inside a number you report as fact. Do that badly and you get a dashboard that looks unified and lies quietly for months. Here is how to do it properly.
Why is stitching three jobs, not one?
Take one product. Your 250ml electrolyte bottle, the one Priya bought from your site last month. It sells on your website, on Blinkit, and on Swiggy Instamart. You want one view of how it is doing.
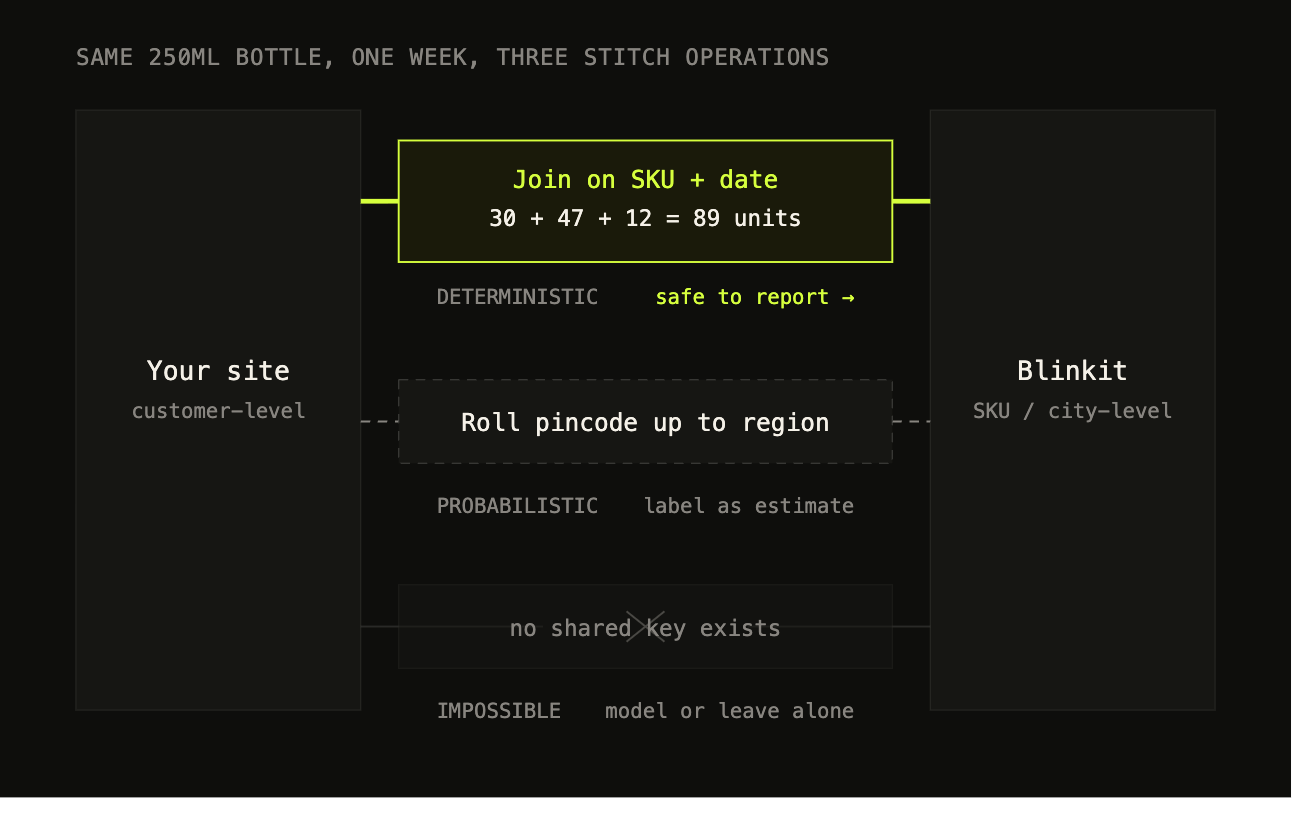
So you sit down to stitch, and immediately you are running three completely different operations without noticing.
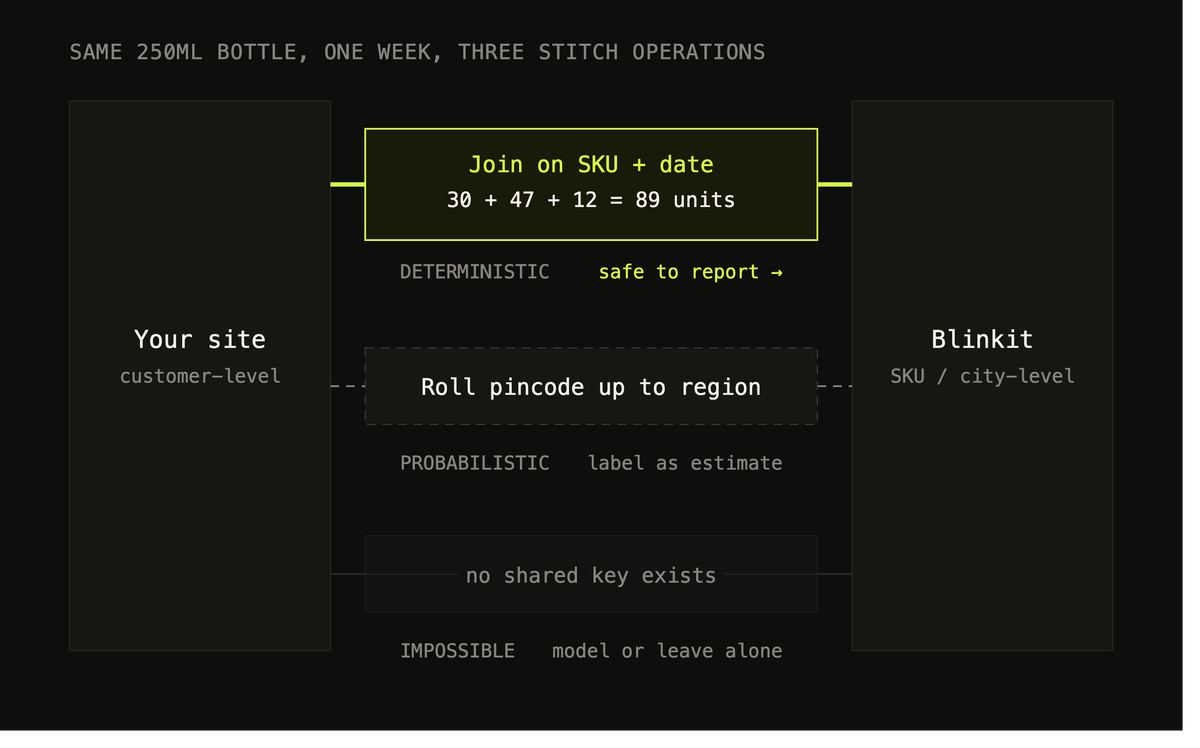
The first is a clean join. Your site says you sold 30 units of the 250ml bottle in Delhi on the 12th. Blinkit Brand Central says 47 units of the same SKU moved in Gurgaon pincodes on the 12th. Both records carry a SKU, a date, and a place. You can line them up on those three fields and the match holds, because a SKU is a SKU and the 12th is the 12th on both sides. This is a real stitch. You can report the sum.
The second is a guess dressed as a join. Blinkit reports Gurgaon at the pincode level. Your site reports Priya's order with a full delivery address. You want to roll both up to "Delhi NCR" so you can compare regions. That rollup works, mostly. But pincodes cross city boundaries, "NCR" means slightly different things in different tools, and a handful of orders land in the wrong bucket every time. Useful for a directional view. Wrong if you treat it as exact.
The third cannot be done. You want to know whether Priya, who bought the bottle on your site, is the same person who bought it on Blinkit the following week. There is no field that connects them. Blinkit will never hand you Priya. The join does not exist, and no amount of SQL conjures the key that was never there.
Same bottle, same week, three operations, three completely different levels of trust.
Most stitched dashboards mix all three together and present the result as one clean number. The rest of this playbook is about keeping them apart.
What is a SKU mapping table, and why does every project stall here?
Before any of those joins run, there is an unglamorous problem waiting. It is where most stitching projects actually stall.
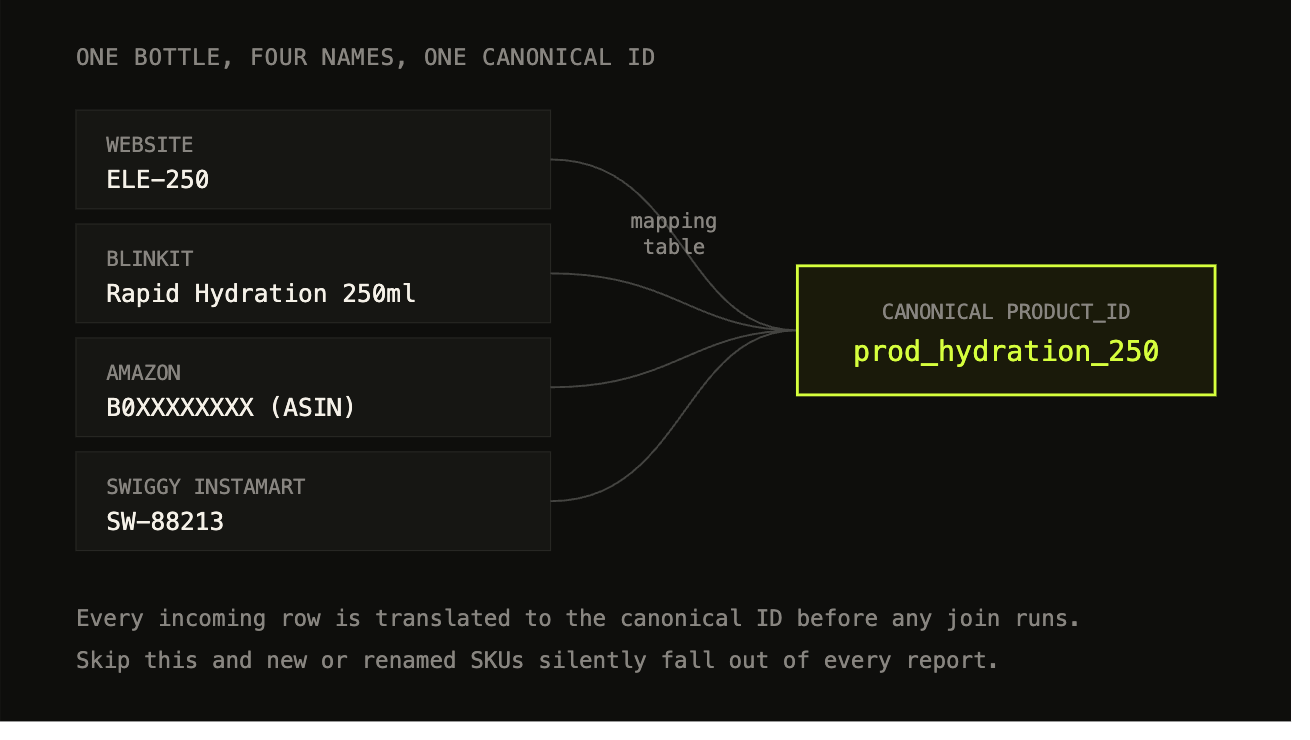
Your 250ml bottle is not called the same thing anywhere:
- On your own site it is
ELE-250in your product database. - On Blinkit it is "Rapid Hydration 250ml" with Blinkit's own internal item code.
- On Amazon it is an ASIN, a ten-character string like
B0XXXXXXXXthat has no relationship to anything you named. - On Swiggy Instamart it is a different code again, tied to your Category Manager's catalogue.
Four platforms, four names for one physical bottle.
A join needs a shared key. "Line up the records where the SKU matches" only works if the SKU means the same thing on both sides, and here it does not.
So before you can stitch anything, you need a mapping table. A plain lookup that says all four of these identifiers are the same product, and here is the one canonical ID we will use internally. Every incoming row from every platform gets translated to that canonical ID on the way into the warehouse. Only then do the joins have something to grip.
This sounds trivial. It is not, for three reasons:
- New SKUs appear and nobody updates the map. Their sales silently fall out of every report.
- Platforms rename listings or merge variants without telling you. A key that worked last month stops matching.
- Variant packs break the one-to-one assumption. A "3 x 250ml" bundle on Blinkit is three of your units, or one bundle SKU, depending on how you decide to count. You have to decide once and hold it everywhere.
None of this is hard analytics. It is bookkeeping. But skip it and every downstream number inherits the gaps, which is why this is the first thing to build and the last thing anyone plans for.
What are the three tiers of stitch?
Once every row speaks the same SKU language, you can stitch. This is the part to get structured about, because the mistake that ruins a cross-channel dashboard is treating all joins as equal. They are not.
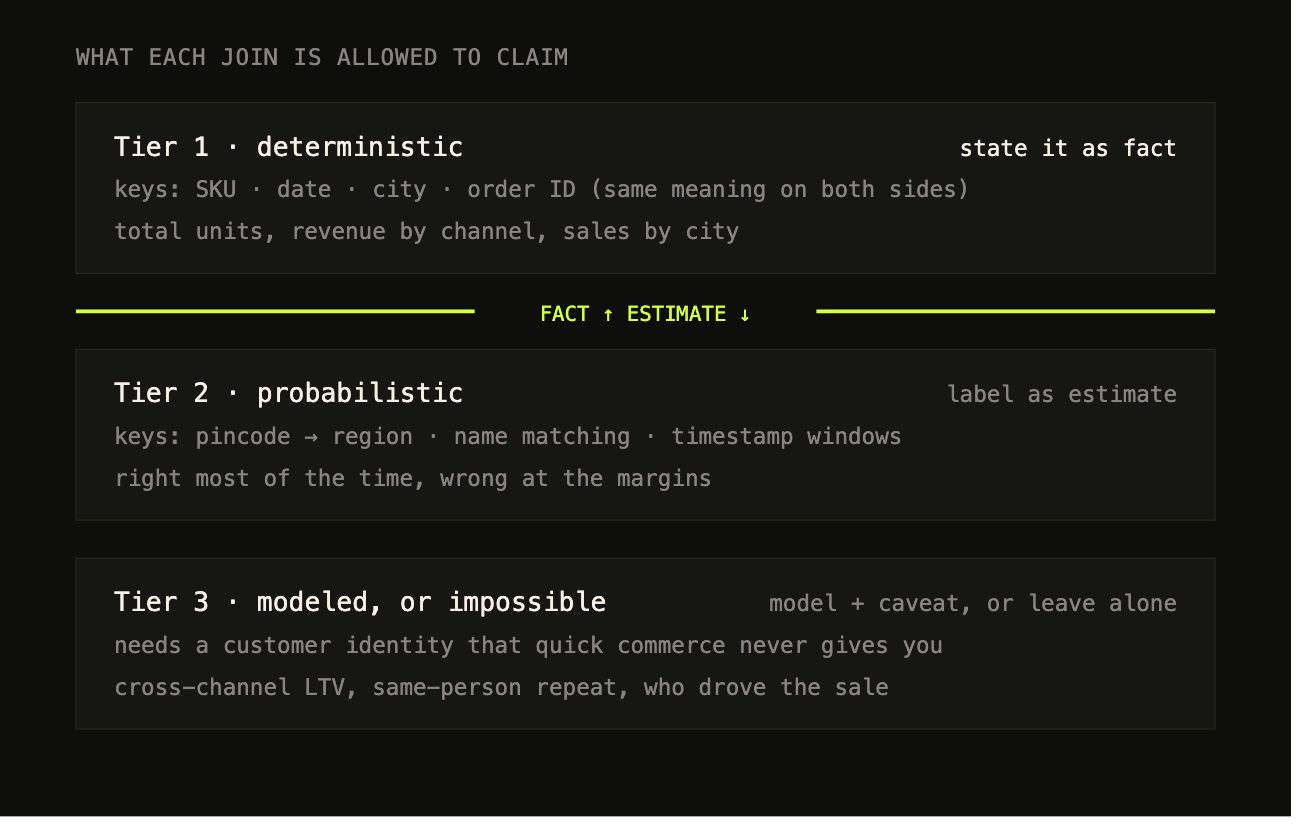
Sort every stitch you want to make into one of three tiers, and be honest about which tier you are in before you report anything from it.
Tier 1: deterministic. Joins on keys that mean exactly the same thing on both sides. SKU, date, city, order ID within a single system.
Your website sold 30 of the 250ml bottle on the 12th, Blinkit moved 47, Amazon shipped 12. Line them up on SKU and date, and you get 89 units sold that day across channels. That number is solid. You can put it on a dashboard, report it to your board, and defend it. This tier is where your trustworthy cross-channel numbers live: total units by SKU, revenue by channel, sales by city, day over day.
Tier 2: probabilistic. Joins on keys that are close but not identical, so the match is right most of the time and wrong at the margins. Rolling pincodes up to regions. Matching a product across platforms by name when a code is missing. Lining up a Blinkit sale with a spike in your Meta spend by timestamp, because they happened around the same time and probably relate.
Every one of these is useful and every one has an error rate. The rule for Tier 2 is simple: use it to see patterns and direction, never to report an exact figure, and label it as an estimate wherever it appears. "Roughly 60% of NCR volume came from these three pincodes" is a fair Tier 2 statement. "Exactly 61.4%" is a lie, because the rollup underneath it is fuzzy.
Tier 3: modeled, or impossible. Everything that needs a customer identity you do not have. Whether a Blinkit buyer is also one of your site customers. True cross-channel lifetime value for a single person. Which channel "really" drove a repeat purchase that happened somewhere else.
You cannot join your way to any of these, because the key that would connect them was never in the quick commerce data. You can sometimes model them, with heavy assumptions and error bars, and label the output loudly as a model. But you cannot stitch them. The most expensive mistake in this whole exercise is quietly treating a Tier 3 wish as a Tier 1 fact.
The tiers are not a ranking where higher is better. They are a map of what you are allowed to say about each number:
- Tier 1 you state.
- Tier 2 you estimate.
- Tier 3 you model and caveat, or you leave alone.
Keep them straight and your dashboard stays honest.
Where does a stitched dashboard silently lie?
Assume you have done all of the above. Mapping table built, tiers kept separate. There is still a set of failures that make a stitched dashboard wrong in ways nobody catches, because the number looks perfectly reasonable. These are the ones that cost you a real decision.
Four to watch for.
Gross versus net. Quick commerce platforms report sell-out, the units that left the dark store. Your own backend reports net of returns, cancellations and orders that failed after checkout. Stitch platform sell-out to your website's net revenue without reconciling, and you are adding a gross number to a net number and calling it total revenue. It will always run high, by a different amount each month depending on return rates, so you cannot even fix it with a flat haircut. Decide up front which basis you report on, and force every source to it before the join.
The MRP trap. This one is specific and it catches almost everyone. Zepto and Swiggy Instamart frequently calculate ROAS in their dashboards using your maximum retail price, not the price the customer actually paid after platform discounts. If your bottle's MRP is ₹500 and it sells for ₹340 after a discount, the platform's dashboard can show a return on ad spend roughly 47% higher than what you earned. Pull that in unquestioned and every channel comparison tilts toward the platform that discounts hardest. Always recompute ROAS on net transaction value, the money that actually arrived, before you let it near a decision.
Time zones and date boundaries. Your website records orders in one time zone, a platform export lands them in another, and a sale placed at 11:40pm on the 12th shows up on the 13th in one of the two systems. On any single day this shifts revenue across the boundary, so a day-over-day comparison shows a dip that never happened and a spike that is just yesterday's tail. Pick one time zone, usually IST for an Indian brand, and convert every timestamp to it before anything is grouped by day.
City name normalization. Your site stores "Bengaluru." A platform export says "Bangalore." Another says "Gurgaon" where a third says "Gurugram." Join on the city string as written and the rows that spell it differently simply do not match, so they vanish from the result. No error, no warning, just a silently smaller number. You need a normalization step that maps every spelling of a city to one canonical form before any city-level join. The same discipline as the SKU mapping table, applied to place names.
None of these throw an error. That is exactly why they are dangerous. The dashboard renders, the number looks sane, and it is wrong.
Every one of them is preventable with a reconciliation step done once, up front. That is the whole point of doing this deliberately instead of hoping the joins line up.
What should you do Monday?
Start with the mapping table, before you build a single pipeline. List every SKU, write down what it is called on each platform, and pick one canonical ID per product. This is the foundation the entire stitch stands on, and it is the thing most projects skip and later regret.
Join only on shared exact keys, and label everything else. SKU, date, city and channel are your Tier 1 fields. Anything built on pincode rollups, name matching or timestamp windows is Tier 2, and it should carry the word "estimate" in the dashboard itself. If a number needs a customer identity across channels, it is Tier 3, and you either model it with visible caveats or you do not show it.
Reconcile the basics once, at the start:
- Decide gross versus net, and force every source to that basis before it enters the warehouse.
- Recompute every platform ROAS on net transaction value, never on MRP.
- Normalize city names and time zones the same way you normalize SKUs, with a lookup that runs before any grouping.
Name the one question you actually need answered, before you build. Total units by SKU across channels? Revenue by city? Whether Blinkit cannibalizes your own site? The first two are Tier 1 and Tier 2, buildable today. The third is Tier 3, and knowing that up front saves you from building a beautiful pipeline that structurally cannot answer the question you built it for.
Get the stitching right and you have something rare: a cross-channel view you can actually trust, where every number knows what it is allowed to claim. That is the foundation for the real question this series has been building toward, which is not what happened, but what your spend actually caused.
That is Part 6, incrementality testing.
Frequently asked questions
What does it mean to stitch website, Blinkit and Swiggy data?
Joining sales of the same product across channels that never share a customer identifier. It sounds like one job. It's really three — a clean key join, a rollup, and an estimate — and they are not equally trustworthy, so you have to know which one you're doing before you report from it.
What is a SKU mapping table?
One table that says your 250ml electrolyte bottle is this name on your site, that name on Blinkit, another on Swiggy Instamart and another on Amazon — with one canonical ID. Four platforms, four names, one physical bottle. Build this before you build a single pipeline; it's where most stitching projects stall.
What are the three tiers of stitch?
Tier 1 is deterministic: joins on keys that mean exactly the same thing on both sides — SKU, date, city, order ID within one system. The other two tiers are rollups and estimates. Keep them separate and label anything that isn't Tier 1, because mixing them is what ruins a cross-channel dashboard.
Why don't quick commerce numbers match my backend?
Gross versus net, most often. Quick commerce platforms report sell-out — units that left the dark store. Your backend reports net of returns and cancellations. Comparing the two without adjusting makes the platform look better than it is.
Can I join on pincode or customer name?
Not as Tier 1. Pincode rollups and name matching are estimates, and they belong in a labelled tier of their own. Join only on shared exact keys — SKU, date, city, channel — and mark everything else as an estimate.
Where should I start?
The mapping table. List every SKU, write down what it's called on each platform, pick one canonical ID. Then reconcile the basics once — gross versus net, timezones, currency — before you trust anything downstream.
Want this on your own stack?
Datalyze rebuilds your data foundation, then finds the growth it's been hiding — proven across 150+ startups.
Book a free analytics audit →