[Week 12] Learning Mixpanel: Mastering Funnels in Mixpanel

![[Week 12] Learning Mixpanel: Mastering Funnels in Mixpanel](https://storage.ghost.io/c/45/2a/452a1712-ece1-4f4c-bf40-52fdca4a4b7b/content/images/size/w1200/2026/02/01ebb1d8-f2c6-4aaa-b858-02b0e6353146_982x509.png)
Introduction
Welcome to Week 12 of Learning Mixpanel. I’m Ansh, a Mixpanel Certified Partner. I’ve had the privilege of working with 60+ startups, helping them set up their analytics infrastructure and gain actionable insights using Mixpanel.
Curious about my work? Check out my website for case studies, testimonials, and more details about what I do.
Tired of Mixpanel data going wrong - events missing, properties breaking, or random spikes?
Pravix makes it simple to detect these issues and keep your data clean.
Today, I’m going to talk about how to Master Funnels in Mixpanel.
Let’s get into it
If your preferred consumption is audio visual - access the video on Youtube
Funnels allow you to build user flow reports in an ordered or unordered way. They help identify friction points (steps with high drop-offs) and show conversion rates from one step to the next.
For example, you can create a funnel to track users who:
Sign up → View a Product → Add to Cart → Complete Purchase
This helps you understand where users drop off and how they move through the process.
Funnels Reports Have 3 Key Parts:
- Metric
- Conversion criteria
- Measurement & Chart Type
Metric
This is where you select the events you want to visualize in the funnel. By default, itʼs an ordered funnel, meaning events must occur in the order they are listed.
Users must complete each step before being counted in the next.
For example, with Sign up → View a Product → Add to Cart → Complete Purchase:
We see 30% of users didnʼt view a product, they are removed from the funnel at that very step. Even if they added a product to the cart, they wonʼt be counted because they missed the previous step.
If Product Viewed isn’t necessary, you should it for a more accurate funnel.
Event Comparison
Event Comparison lets you compare two events side by side in the funnel.
For example, you can see how many users who sign up complete a purchase via
Express Shipping vs Standard Shipping:
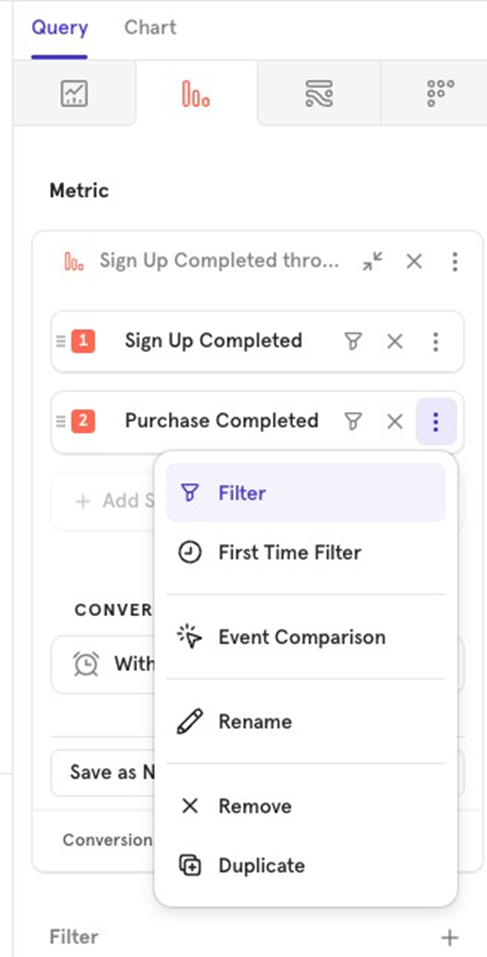
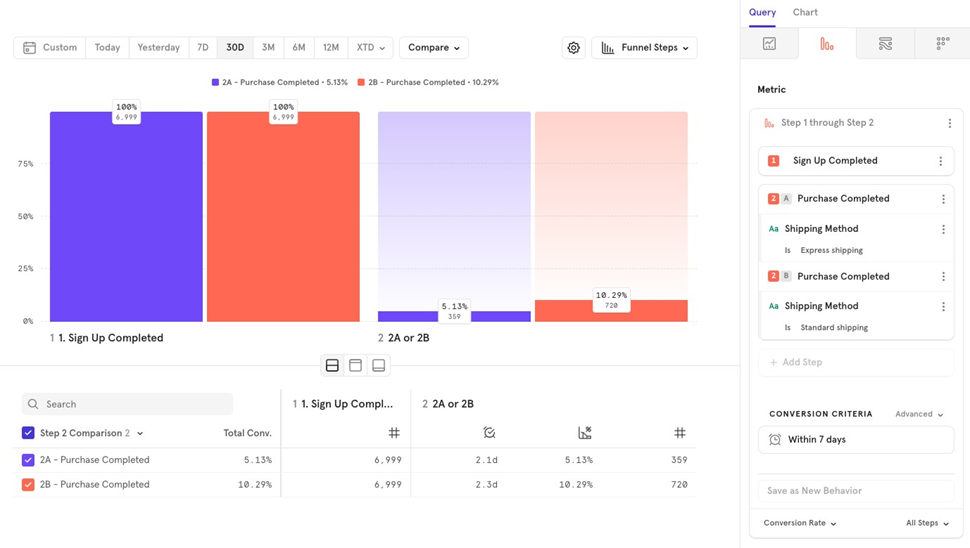
If a user purchased using both shipping methods, theyʼll be counted in both. This is helpful for comparing user behavior between different events in the funnel.
Conversion criteria
Conversion criteria is a way for you to define rules for your funnel.
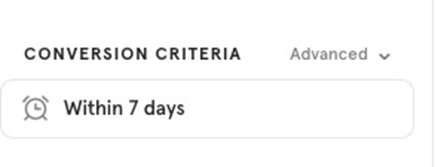
Conversion Window
The Conversion Window specifies how much time a user has to complete all steps in the funnel, starting from the first step.
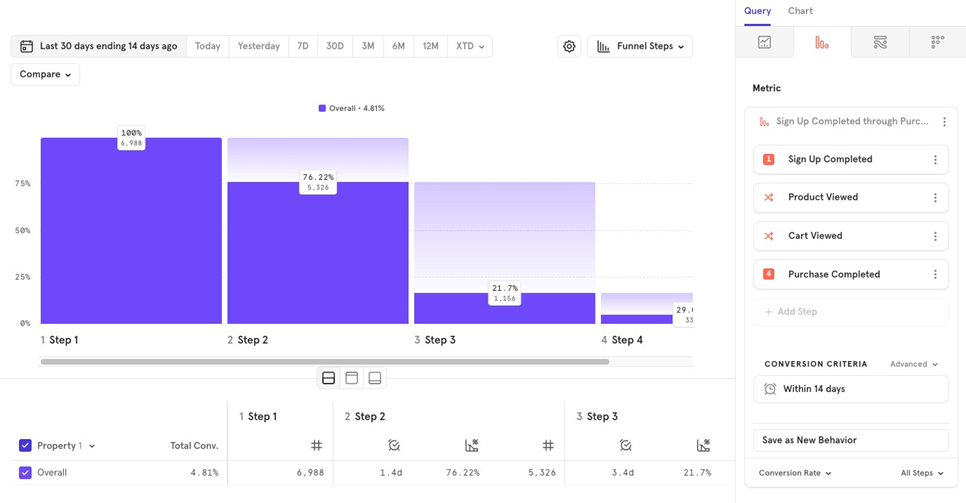
For example, if your funnel tracks Sign up completed to Purchase completed, you can set a time limit, such as 14 days, for users to complete the funnel after signing up.
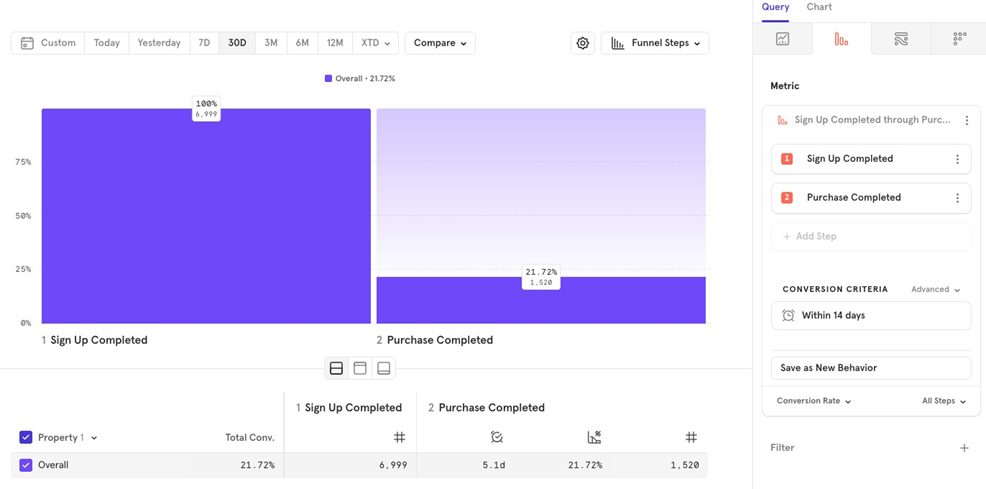
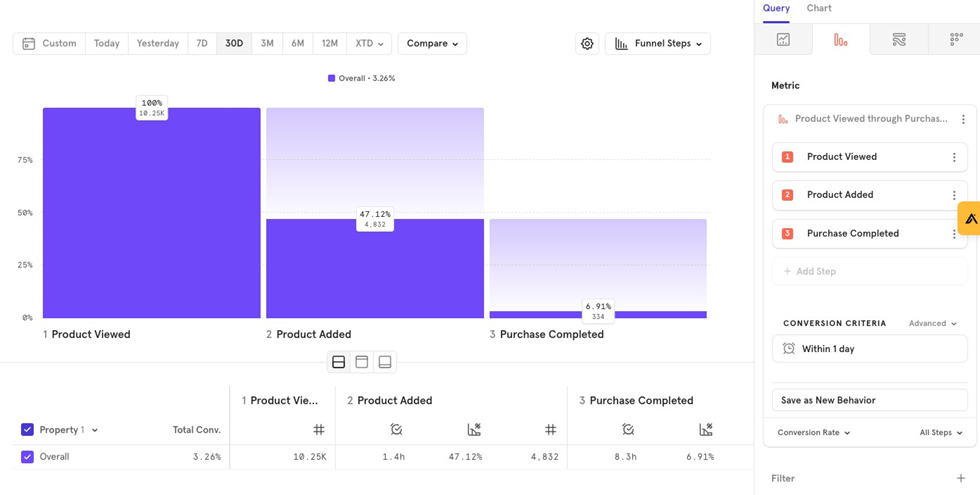
In out funnel with a 14-day conversion window in the last 30 days, some users who signed up within the last 14 days may still be in the process of completing their purchase. Since these users haven’t yet reached the end of their 14-day window, they havenʼt had enough time to finish the funnel.
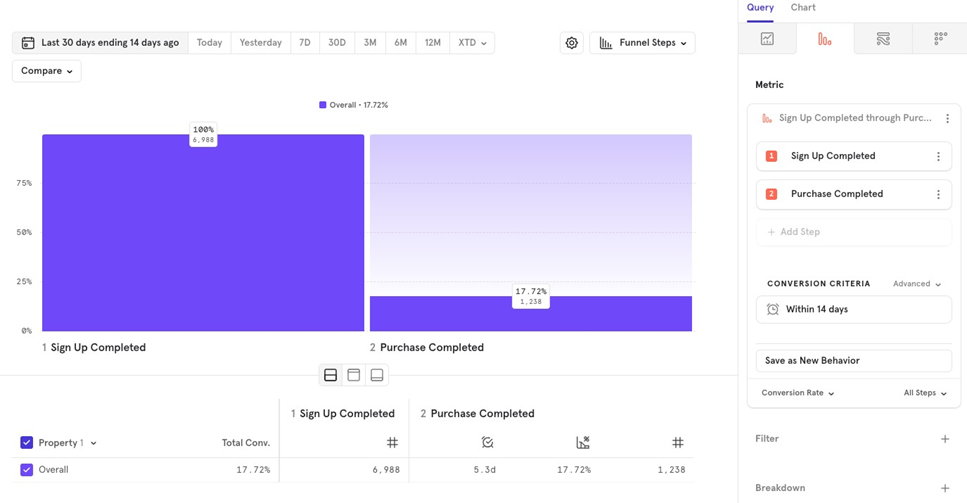
To avoid this, adjust the date range to Last 30 days, ending 14 days ago. This ensures all users have had time to complete the funnel, providing a more accurate conversion rate.
You can choose from various time units for the conversion window: Seconds
- Minutes
- Hours
- Days
- Weeks
- Months
- Sessions (Mixpanel sessions)
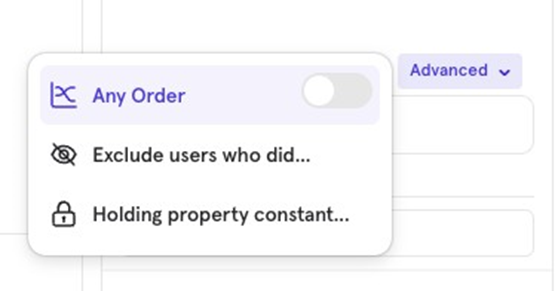
Any Order
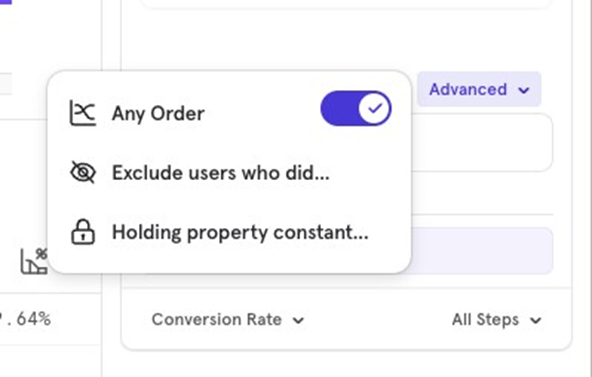
The Any Order option allows users to complete certain funnel steps in any sequence, rather than in the specific order defined.
For example, in a funnel like Sign up Product Viewed Product Added Add to Cart, if you select Any Order, it means that after Sign up, users can complete the remaining steps in any order.
A user could do Sign up → Add to Cart → Add Product → View Product, and still be considered as having completed the funnel.
However, if a user only signs up and adds a product, but skips the other steps, they will only be counted up to Step 2.
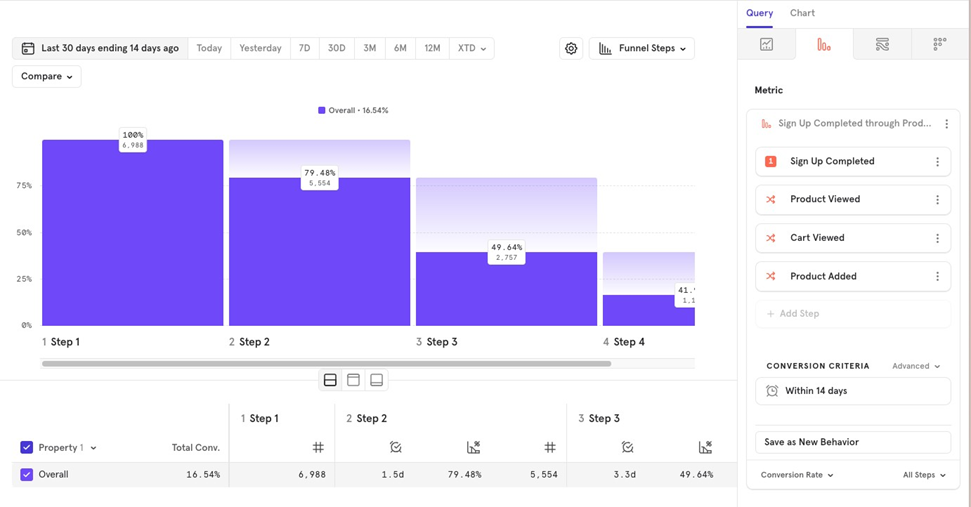
Letʼs say your funnel is Sign up, Product Viewed, Cart Viewed, Purchase Completed. Here, Product Viewed and Cart Viewed can be completed in any order,but Sign up must be the first step, and Purchase Completed must be the last step.
With Any Order, a user must:
- Sign up first.
- Complete both Product Viewed and Cart Viewed in any order.
- Finish with Purchase Completed to be counted as completing the funnel.
If the user only completes one of the middle steps Product or Cart Viewed) before completing the purchase, they won’t be counted as fully completing the funnel. Both middle steps must be completed, just in any order.
Exclude Users who did Event A
This feature allows you to exclude users from your funnel if they performed a certain event at any point during the funnel or between specific steps.
For example, in a funnel like Product Viewed, Product Added, Purchase Completed, you may want to exclude users who searched for a product between viewing and purchasing a product.
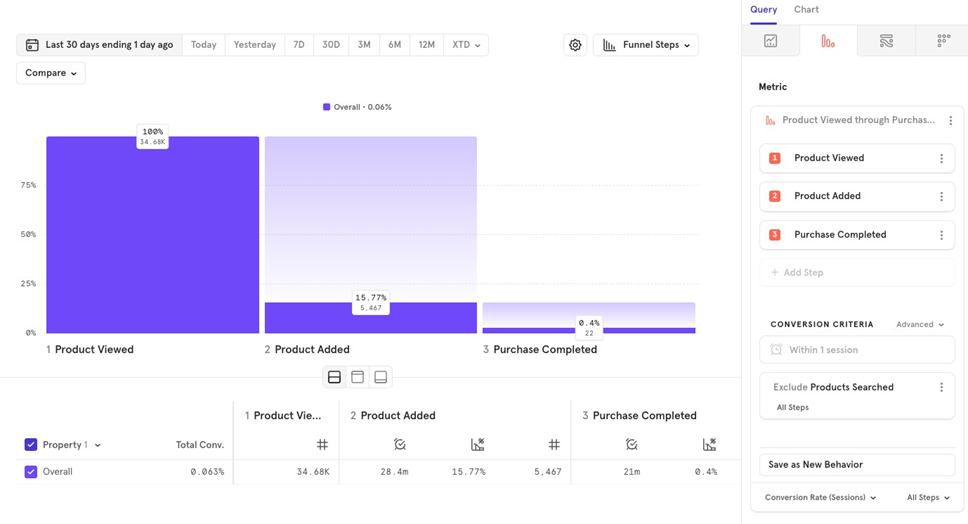
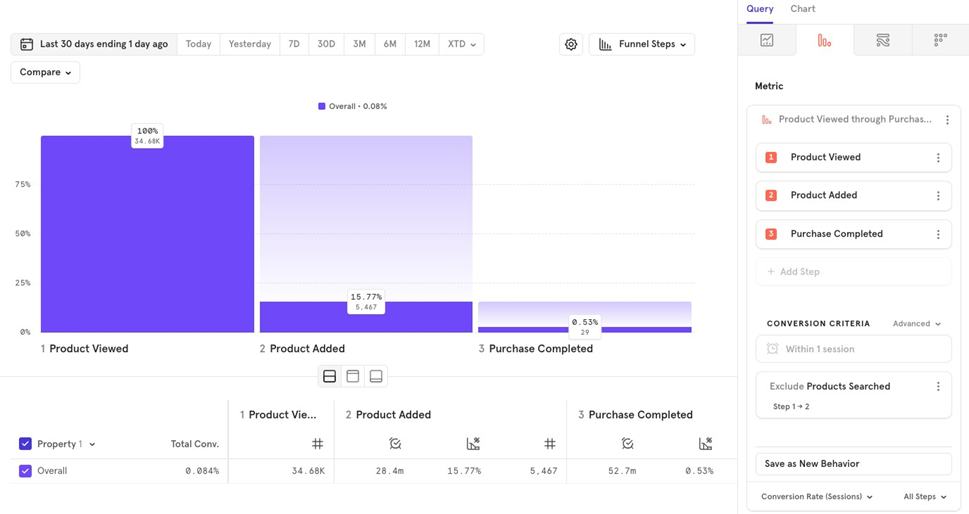
You can also narrow the exclusion, such as excluding users who searched for a product only between Product Viewed and Product Added. This means users who searched during that time will not be counted in the entire funnel.
Note: If youʼre looking at users that did event A, then event B, did not do event C, but then perform D user that did event C would still be counted in the funnel as having done A and B, but they would not qualify in the funnel for event D. This, because users are excluded at that point in the funnel.
Holding Property Constant
This option allows you to define a funnel where a specific property remains the same for all events in order to count as a conversion.
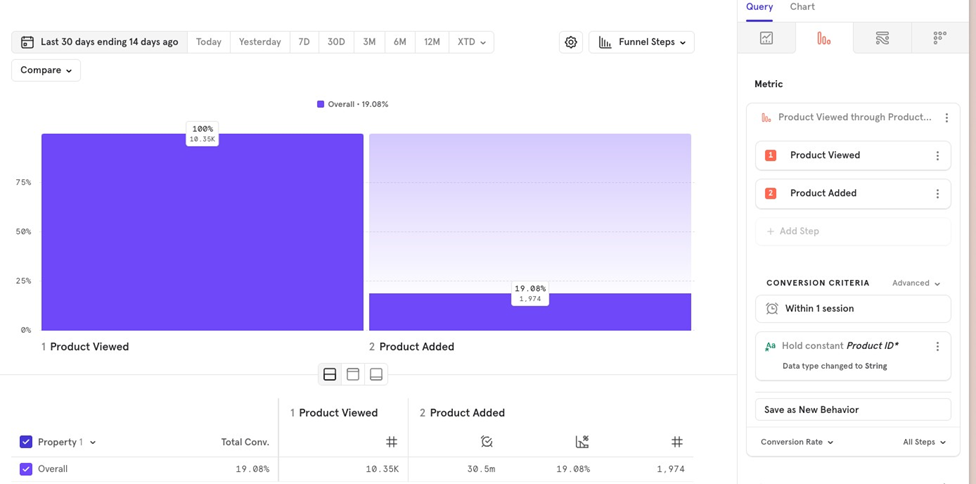
For example, in a funnel from Product Viewed to Product Added, you can require that the Product ID is the same for both events. This ensures that if a user views a product, they must add the same product to the cart for it to count as a conversion.
Without holding the property constant, a user could view one product and add a different product, which would still count as a conversion. By keeping the property constant, only users who view and add the same product are counted.
Measurement & Chart Type
This is where you choose how you want to measure your funnel, be it in terms of unique users, totals, sessions, time to convert, etc. along with choosing the type of chart best suited for the funnel.
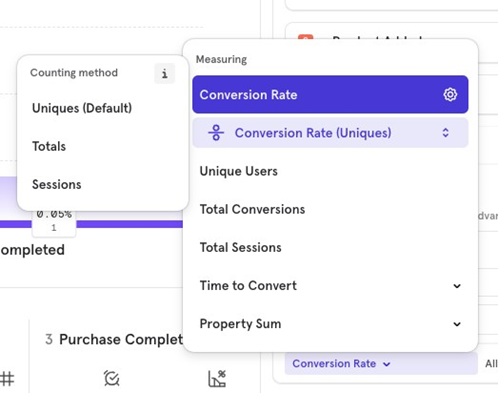
Measurement & Chart Type: Conversion rate
Conversion rate is your default funnel measurement, which tells you out of many users that performed the 1st step, also did the 2nd step respecting your conversion criteria.
By default, conversion rate is set on a user level, which means the funnel is on a user level.
The funnel measurement could be set on 3 levels (unique users, totals and sessions). Each one of them works differently to each other in how they calculate the values.
A user only re-enters the funnel, once theyʼve exited the funnel. A user can exit the funnel in any of the following scenarios:
- Theyʼve successfully completed the funnel
- Theyʼve failed to complete the funnel, and the conversion criteria is over
If the user has multiple entries of the 1st event of the funnel, before theyʼve exited the existing funnel, the first event count will be counted only once, and not twice.
Keep in mind that the conversion window starts on the first instance of the Step 1 event per funnel entry, and will not be updated by later instances of the same event in the same funnel trial.
For example, let’s assume a funnel with the following criteria: A B C, conversion window of one hour.
If the user does A at 1pm and then A again at 1:30 pm, before doing B at 1:45 pm and C at 2:15pm, they would count as converting to B, but will not be counted as completing the entire funnel to C. This is because 1pm to 2:15pm is greater than one hour. The conversion window for a given funnel trial starts with the first instance of A and is not reset by later instances of A in the same trial. B and C need to be completed within the conversion window from the first instance of A to be counted as conversions.
To explain all 3, letʼs take the funnel: Product viewed, Add to cart, Product purchased funnel and our conversion criteria is 1 day.
Unique users Conversion rate
When you choose a unique user conversion, you will see that the user will only be counted once, & the 1st time they enter the funnel.
If they perform the events multiple times, theyʼd only be counted the first time they do it. So, if a user does not convert the first time, but does a 2nd time, on a user level theyʼd be counted as not converted. The user does not re-enter the funnel in case of unique users conversion criteria.
So, we have 2 users who did the following:
User 1 Product viewed on Day 1 Add to cart on Day 1 Product purchased funnel on Day 1 Converted.
User 2 Product viewed on Day 1 Product viewed on Day 2 Add to cart on Day 2 Product purchased funnel on Day 2 Not converted .
User 3 Product viewed on Day 1 Add to cart on Day 1 Product purchased funnel on Day 1 Converted Product viewed on Day 2 Add to cart on Day 2 Product purchased funnel on Day 2 :converted only once, as conversion criteria is on a user level.
This is because Mixpanel only counts the first entry of the user, and if itʼs successful once, thatʼs it. It does not count the user again, and if the 1st entry is not converted, the user is still not counted again.
Totals Conversion rate
When you choose this, Mixpanel counts your conversion on an event level. And, the user can re-enter the funnel once theyʼve exited the previous funnel.
User 1 Product viewed on Day 1 Add to cart on Day 1 Product purchased funnel on Day 1 Converted
User 2 Product viewed on Day 1 Product viewed on Day 2 Add to cart on Day 2 Product purchased funnel on Day 2 Converted This happens because user did not convert on day 1, thatʼs why he was added to day 2
User 3 Product viewed on Day 1 Add to cart on Day 1 Product purchased funnel on Day 1 Converted Product viewed on Day 2 Add to cart on Day 2 Product purchased funnel on Day 2 :converted twice
User 4 Product viewed on Day 1 Product viewed on Day 1 Add to cart on Day 1 Product purchased funnel on Day 1 Converted only once and 100% conversion
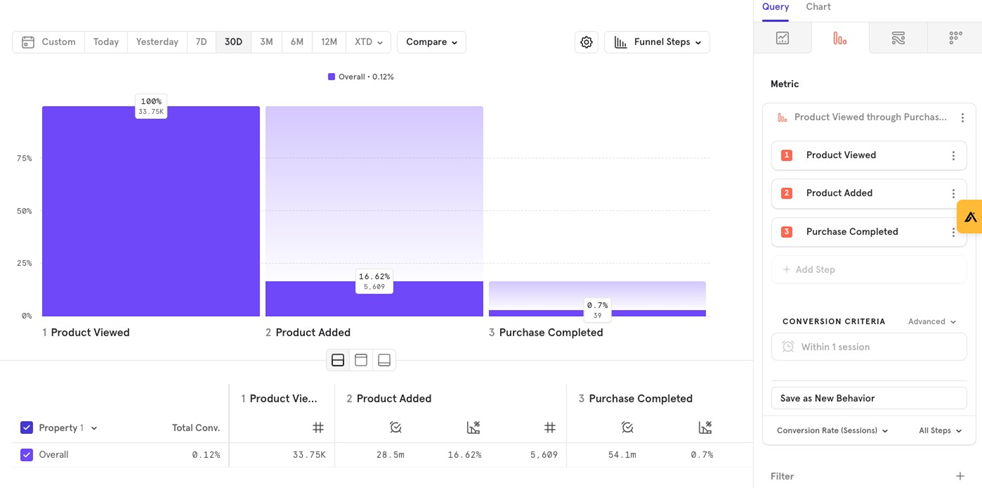
Sessions Conversion rate
This works on Mixpanel session level, very similar to Event totals, and here also user is only counted again if they exit the funnel once.
Think of this as a dynamic time funnel, because sessions could have multiple timings depending on how much the user uses the app.
User 1: Product viewed on Session 1 Add to cart on Session 1 Product purchased funnel on Session 1 Converted
User 2: Product viewed on Session 1 Product viewed on Session 2 Add to cart on Session 2 Product purchased funnel on Session 2 Converted This happens because user did not convert on day 1, thatʼs why he was added to Session 2
User 3: Product viewed on Session 1 Add to cart on Session 1 Product purchased funnel on Session 1 Converted Product viewed on Session 2 Add to cart on Session 2 Product purchased funnel on Session 2 :converted twice
User 4 Product viewed on Session 1 Product viewed on Session 1 Add to cart on Session 1 Product purchased funnel on Session 1 Converted only once and 100% conversion
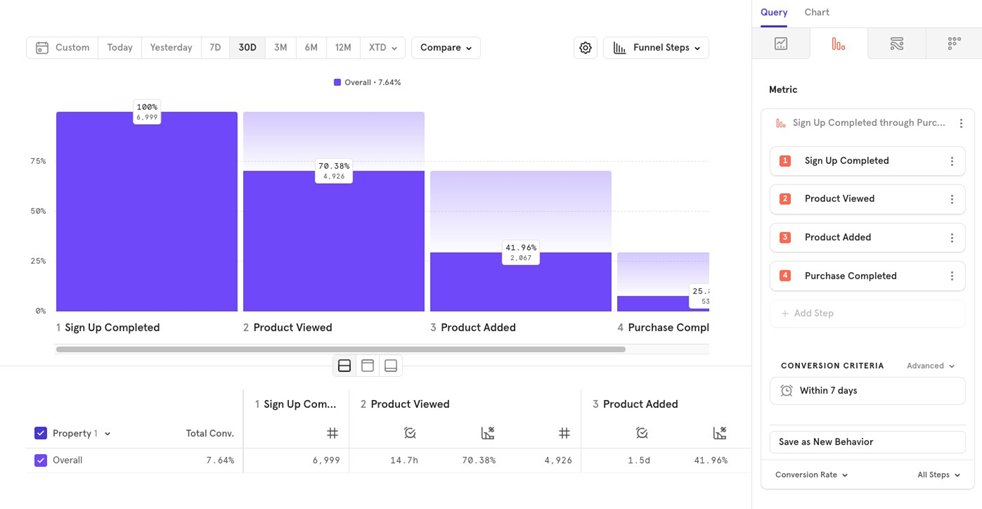
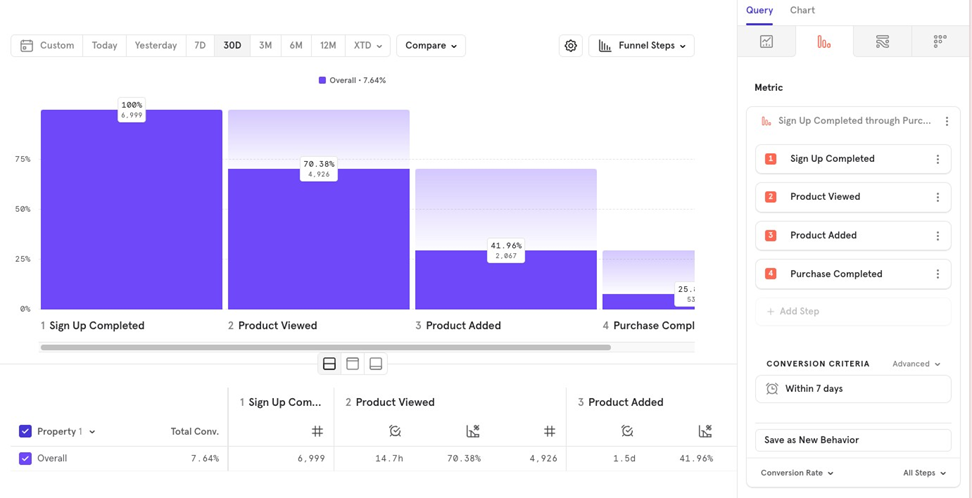
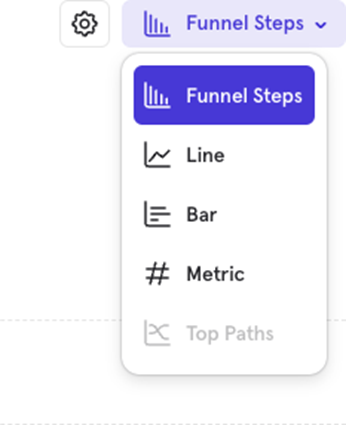
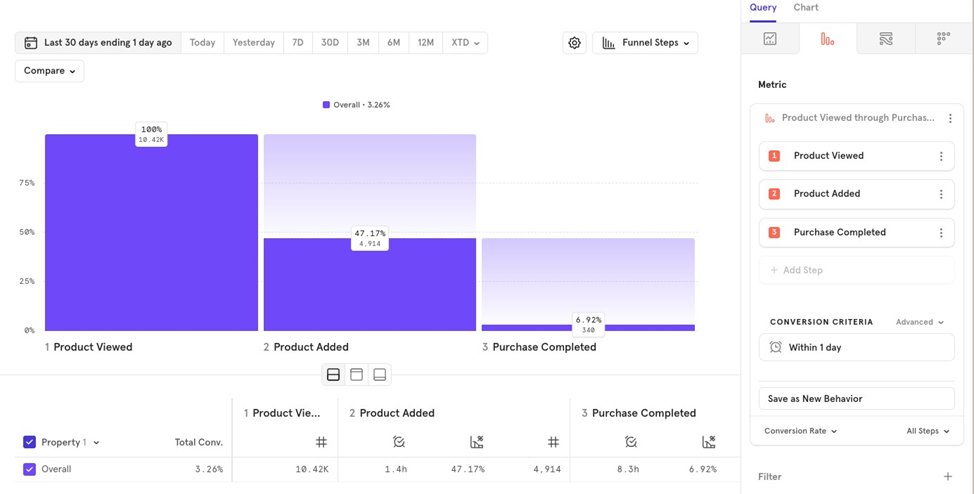
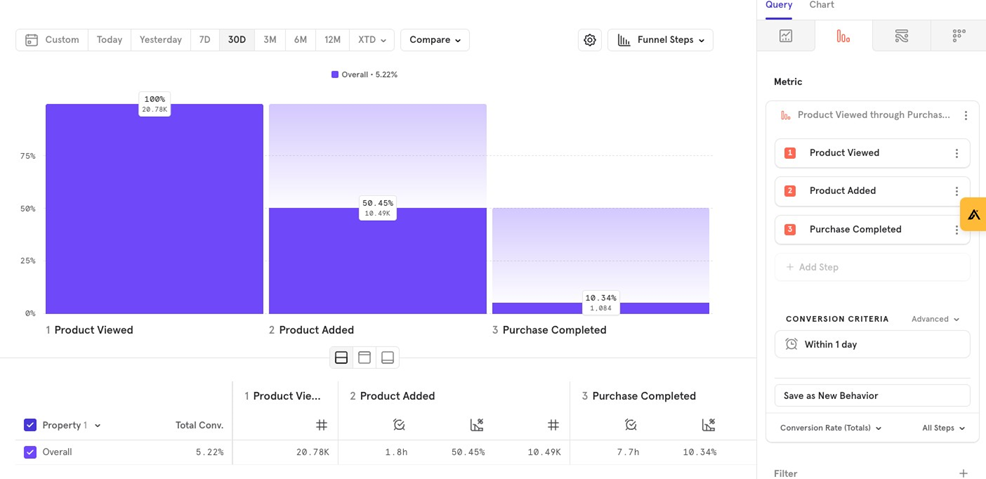
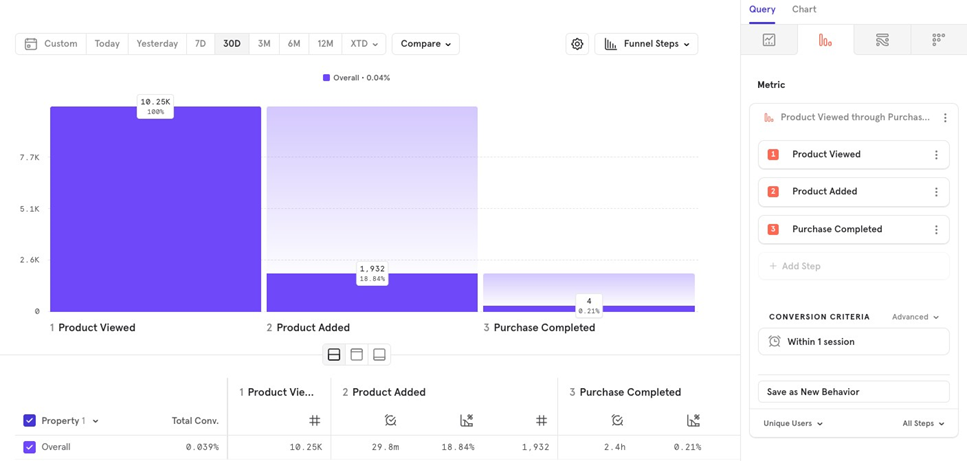
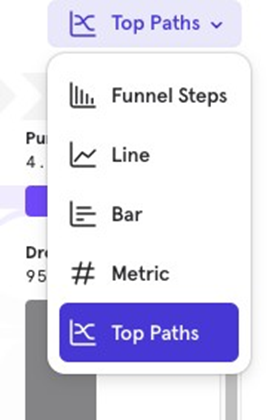
Funnel Steps - Chart Type
Funnel Steps is a chart type which shows conversion rate from previous step, at each step.
For example, you want to look at Product Viewed Product Added Purchase Completed funnel in the last 30 days. Funnel steps gives you an overview of the funnel drop offs and conversions at each step
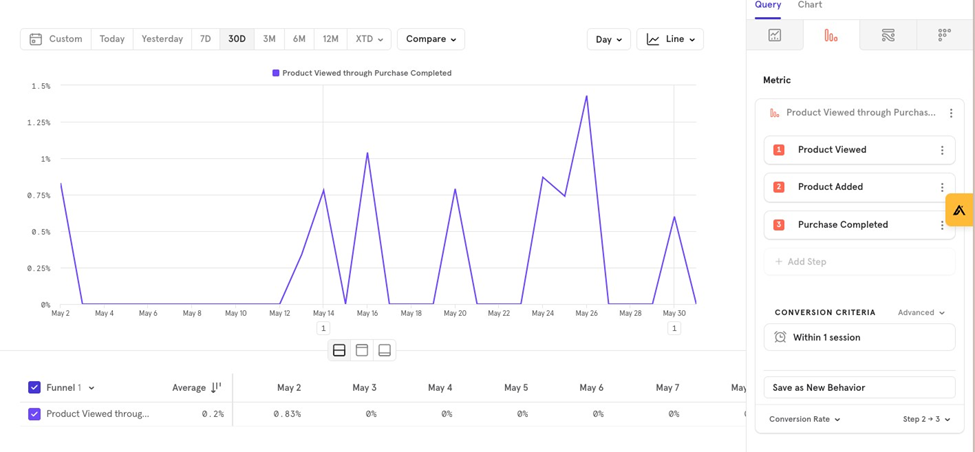
Line Chart - Chart Type
Line Chart can be used to visualize the funnel over time. For example, you want to look at Product Viewed Product Added Purchase Completed funnel in the last 30 days, and want to see how this funnel value has changed over time.
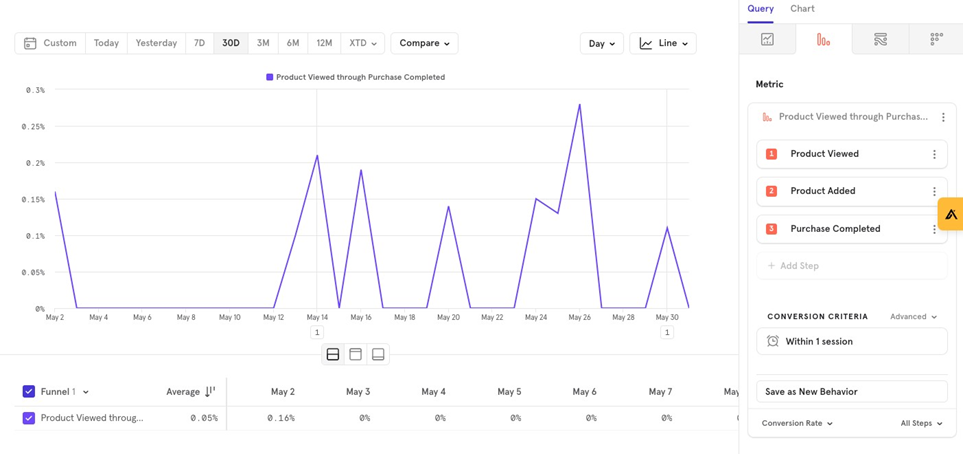
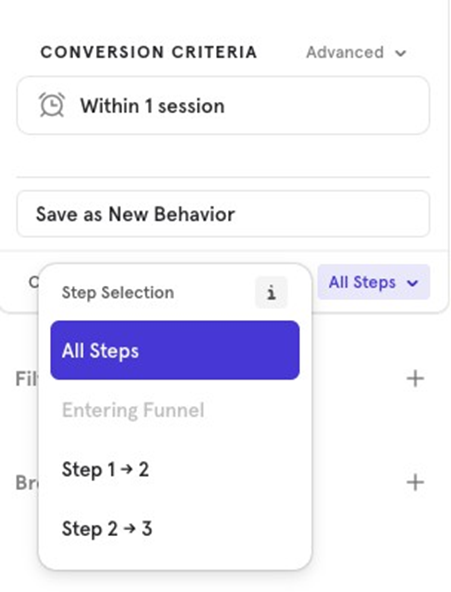
By default, Line chart will show conversion from Step 1 to last Step. In case you want to look at specific step conversions, you could do that too.
For example, you want to look at conversion from Product Added to Purchase Completed Step 2 Step 3.
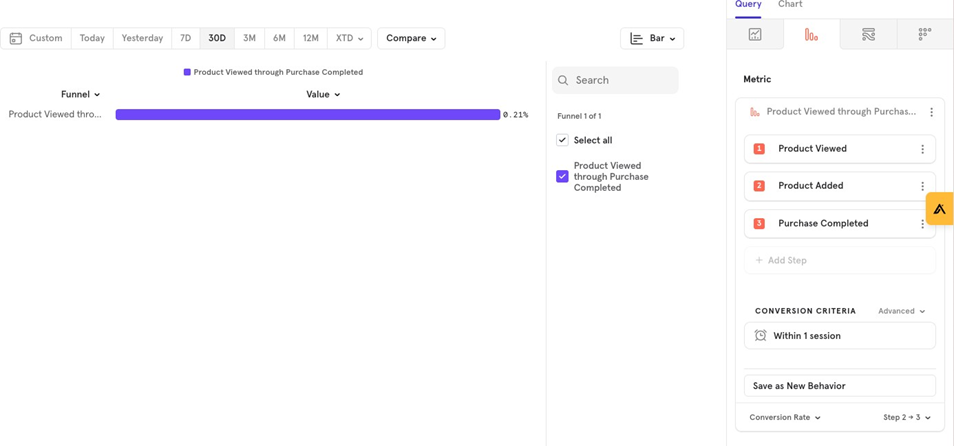
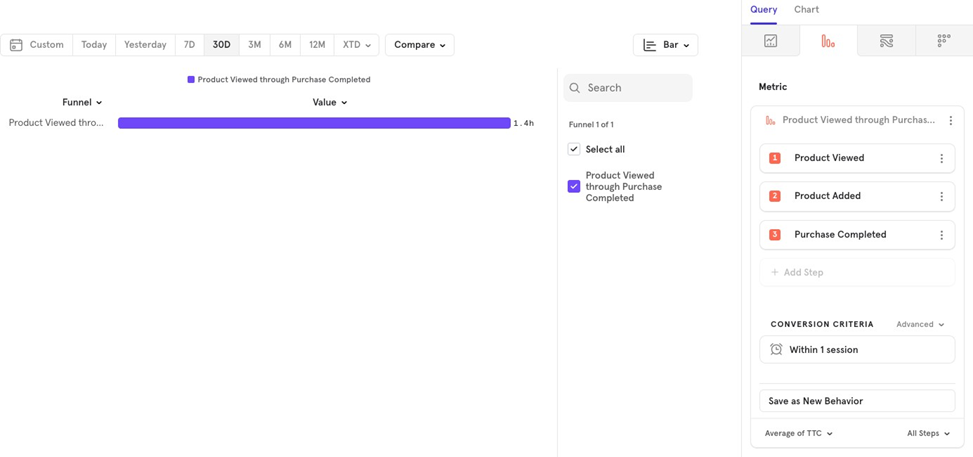
Bar Chart - Chart Type
Bar Chart is helpful to give a summary view of the entire conversion rate from Step 1 to last step, or between specific steps Step 2 Step 3
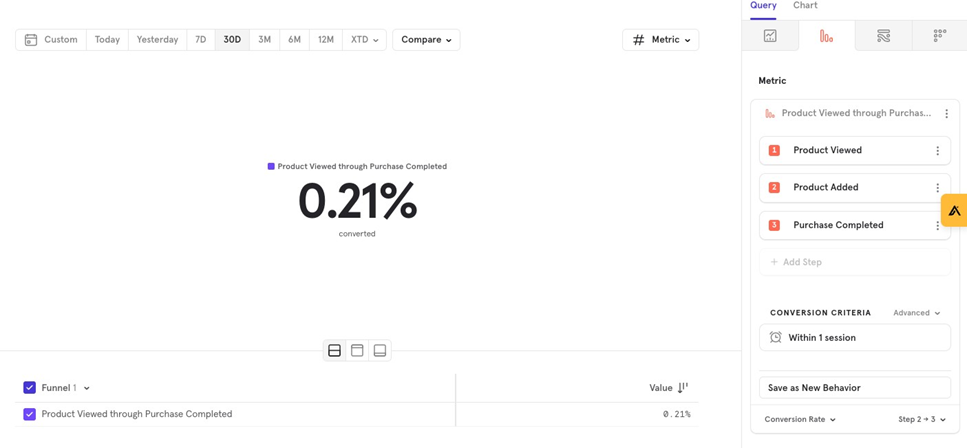
Metric - Chart Type
Metric is very similar to Bar Chart, in the way that itʼs useful to give out a summary view of the conversion funnel, either from Step 1 to last step, or between specific steps Step 2 Step 3.
Measurement & Chart Type: Unique Users, Total Conversions and Total Sessions
While measuring conversion rate, we were majorly looking at % of users from previous step going to the next step as the actual value.
However, when we change the measurement from conversion rate to one of Unique Users, Total Conversions and Total Sessions - weʼre looking at the total number of users, events, and sessions instead of %.
Unique Users: Displays the number of users at each step of the funnel
Total Conversions: Displays the number of conversions (at an event level) at each step of the funnel.

Total Sessions: Displays the total number of unique user sessions at each step of the funnel

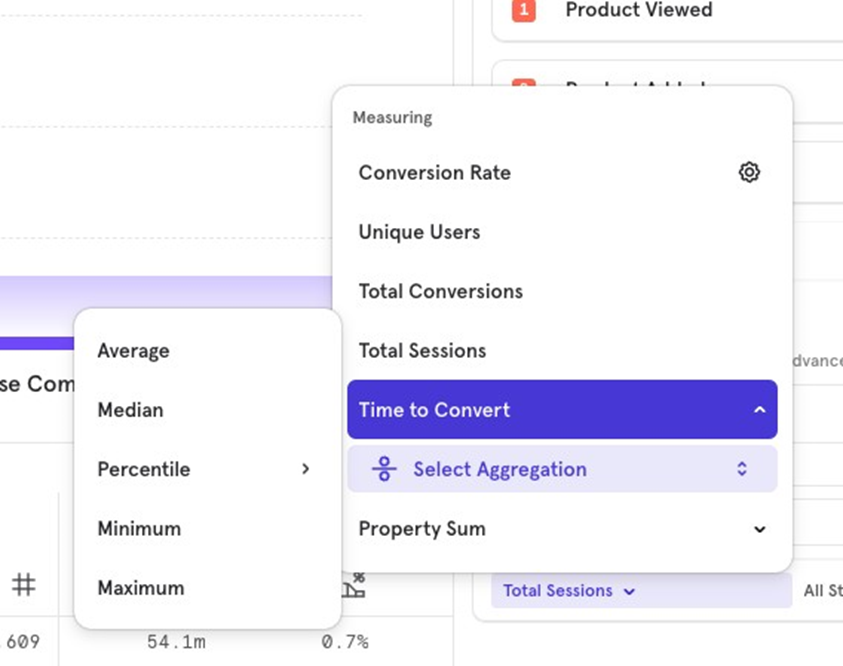
Measurement & Chart Type: Time to Convert
Time to convert allows you to visualize the time it takes for users to move from one step to another in the funnel.
Mixpanel offers multiple measurement options for time to convert:
- Average
- Median
- Percentile
- Minimum
- Maximum
Letʼs say you want to look at Average time it takes for a user to move from Viewing a product to completing a Purchase.
Mixpanel will consider users that completed a purchase, and calculate the average time it took them to do so.
Time to Convert: Product Viewed to Product Added
In case you want to understand how much time it took users to add a product, from product view, you can change “All Stepsˮ to “Step 1 2ˮ

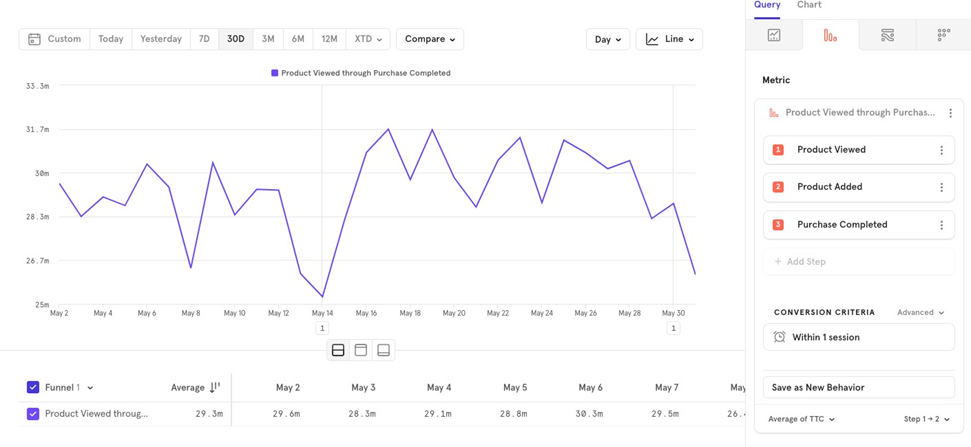
Time to Convert: Line Chart
In case you wish to visualize how the average changes over time, you could simply change the chart type to a Line Chart.
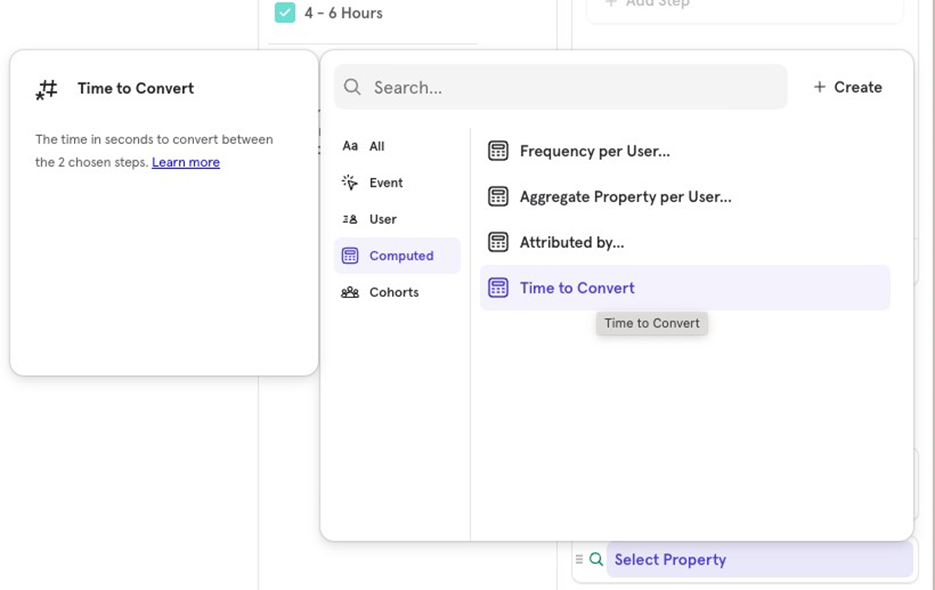
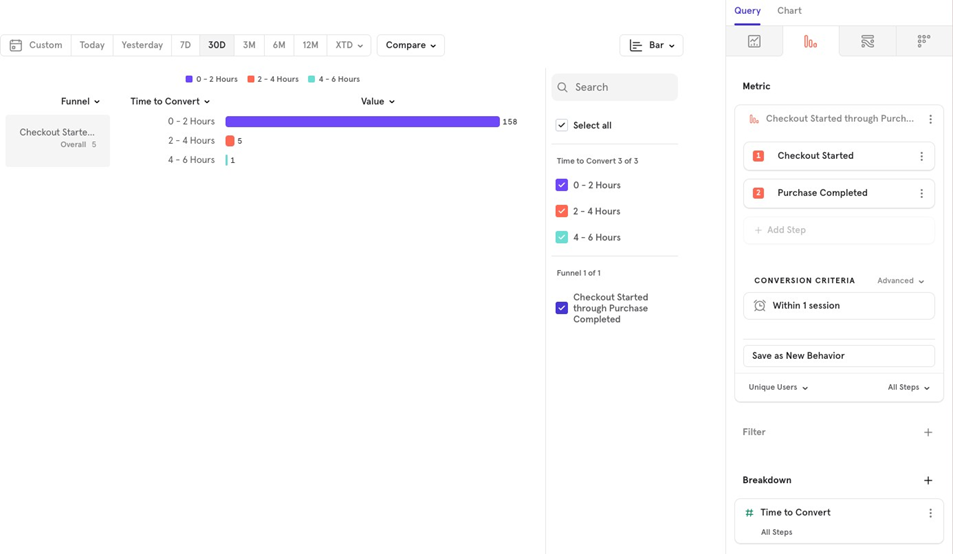
Time to Convert: Distribution
Instead of looking at aggregated values like average, median, etc. time to convert from one step to another, you might want to look at total converted users, conversions or sessions by their distribution of time to convert.
In such a case, you can choose “Time to Convertˮ from Breakdown menu, and look at the distribution.
Note: Distribution makes sense to look at in a Bar Chart. And, you need to select from Unique Users, Total Conversions, or Total Sessions for this metric to make sense
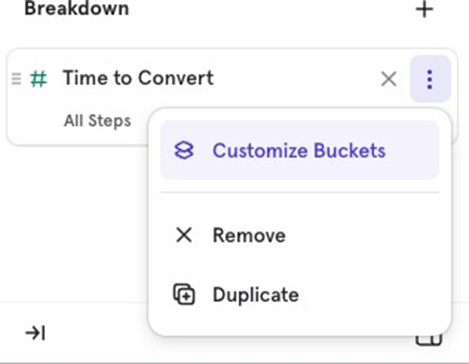
You could also customize the buckets of time to look at relevant time intervals.
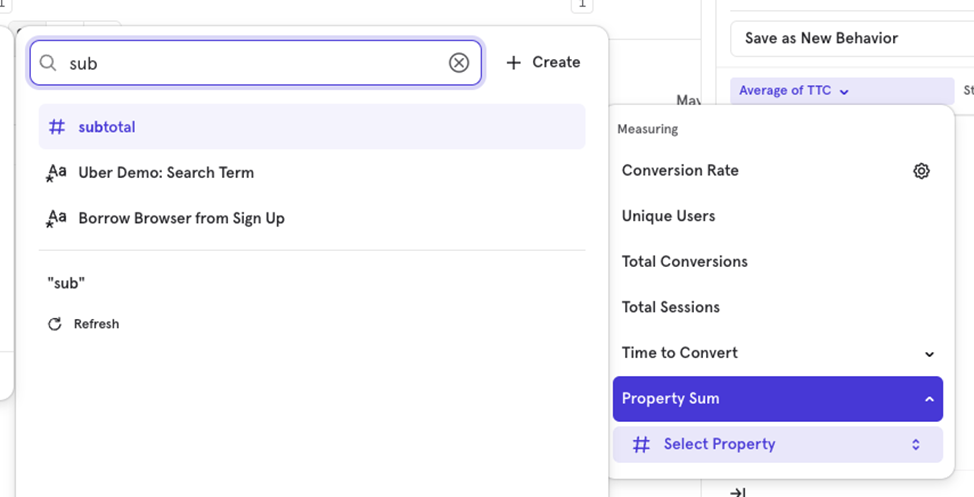
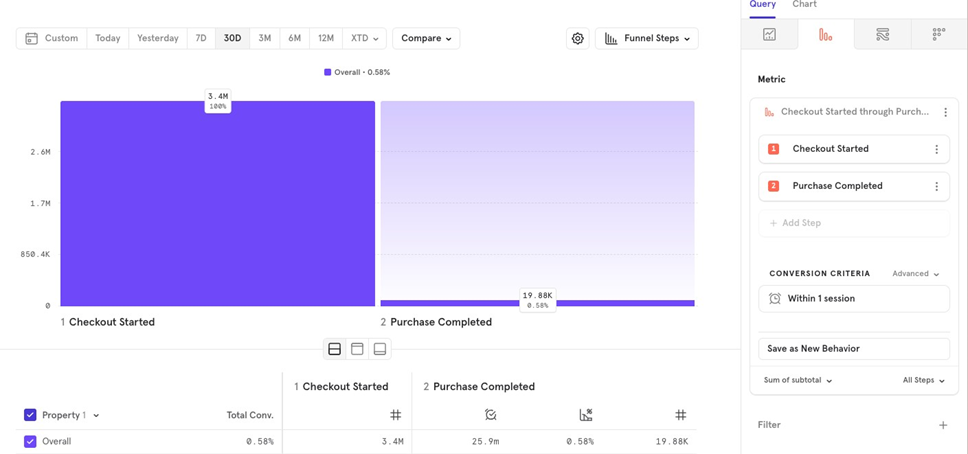
Measurement & Chart Type: Property Sum
Property Sum helps you visualize how the sum of a numeric value changes with each funnel step.
For example, you want to know from Checkout Started to Purchase Completed, how much you lost or made in that funnel in terms of revenue.
Filters
Filters work the same way as we spoke about in the Insights section. The only thing you need to take care of here is Local filters vs Global filters.
For example, you have a funnel from Checkout Started to Purchase Completed, and you apply a local filter on Shipping method Express Shipping. Youʼre counting conversions on a User level.
And, letʼs say thereʼs a user who has checkout Started from both methods, Express and Normal shipping.
Local filters
When you apply a local filter to any funnel, the filter is first applied to an event, and then the eligible values are taken.
In the above example what will happen is that the filter will be applied, and then the instance of the user with Shipping method Express will be chosen as the entering step in the funnel
Global filters
When you apply a global filter to any funnel, the funnel is first calculated, and then the filter is applied.
In the above example, letʼs say the users 1st Shipping method was normal shipping, and the 2nd one was express shipping. Now, since the funnel is first calculated, the event chosen for Checkout started will be the one with Normal shipping.
Once you apply the filter on Express shipping, this user will not be counted in the funnel, even though they had a Checkout started event with Express shipping.
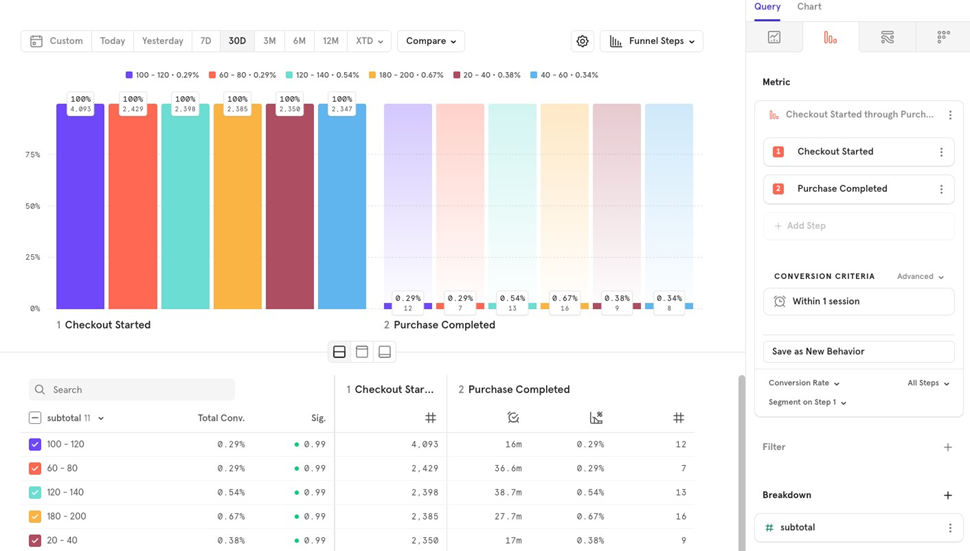
Breakdowns
Breakdowns are helpful while trying to understand conversion value across different property values/ attributes.
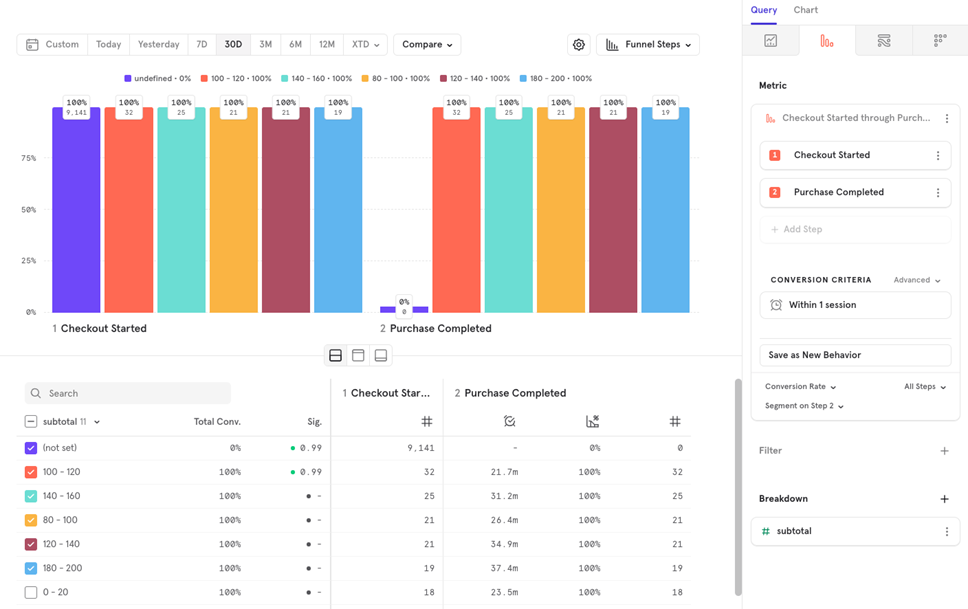
For example, you want to understand how the Checkout started to Purchase completed conversion differs across different slabs of amount, you could breakdown the funnel by subtotal.
Note: Within Breakdown, if you break down by a property say Shipping method, and user is present in Express shipping, as well as Normal shipping, theyʼd show up as 2 separate conversions. This is different from how Global filters would work, where youʼd see it only once.
Segment on Step
When you Breakdown by a property in funnels, you can choose where the property value should segment the funnel → at which step of the funnel.
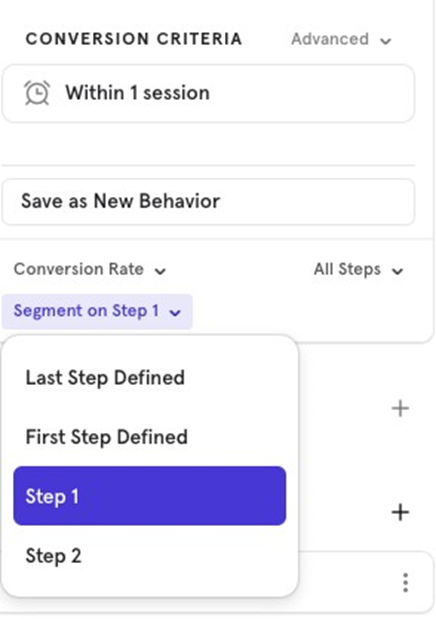
For example, in our case - we segmented it at Step 1 of the funnel because we wanted to look at conversion rate by amount.
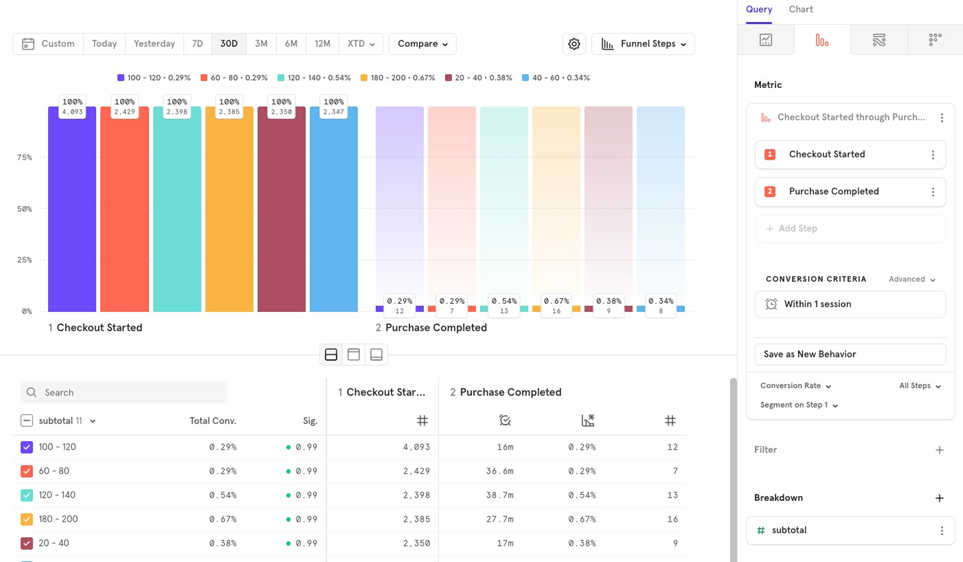
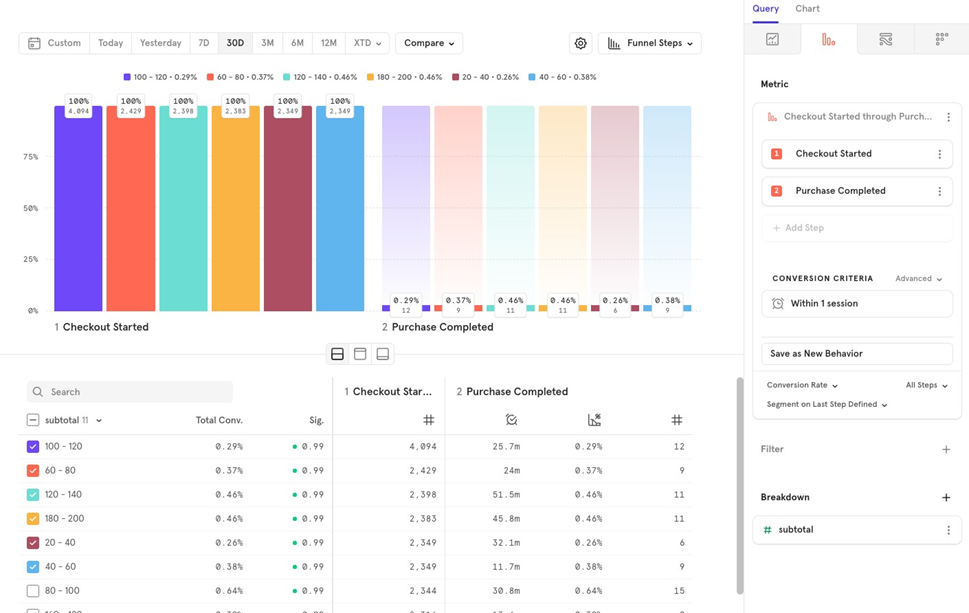
If we segment at Step 2, we will see a lot of values as not set as they did not qualify for Step 2, so we donʼt know what the subtotal value was at step 2.
Apart from specifically choosing a step, you could also choose from:
- Last Step Defined: Whenever the property is found last with whichever step, that would be the value taken. For example, take an example of a funnel from Product View Product Added Product Purchased. Now, all 3 of these events have category as a property. However, for a user the category is A in Product Added event, and B in Product Purchased event. In last step defined, when broken down, it will be attributed to B.
- Note: For users that did not qualify to Product Purchased, their property will be defined at Checkout Started.
First Step Defined: Whenever the property is found first with whichever step, that would be the value taken for the entire funnel. When broken down, it will be attributed to A
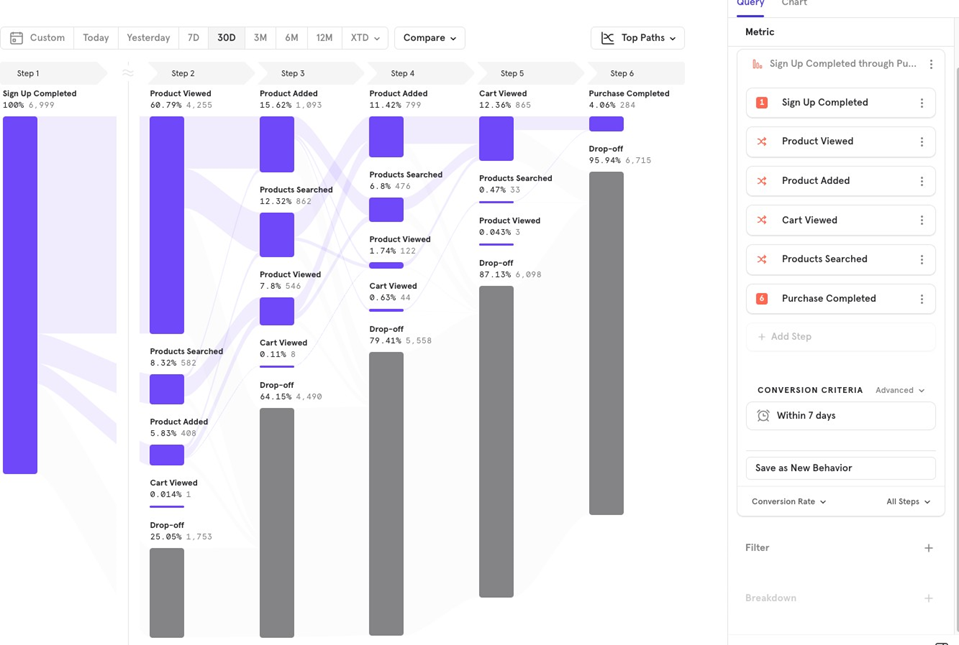
Top Paths
Top Paths are available only for Any Order funnels. They help you see the most common paths users take to move through the funnel.
For example, in a funnel from Sign Up Completed to Purchase Completed (the first and last steps), users may take different actions in between, such as viewing a product, adding a product, or searching.
Top Paths will show you the most popular paths users followed to reach the final step, helping you identify the most common user journeys.