[Week 13] Learning Mixpanel: Retention Analysis

![[Week 13] Learning Mixpanel: Retention Analysis](https://storage.ghost.io/c/45/2a/452a1712-ece1-4f4c-bf40-52fdca4a4b7b/content/images/size/w1200/2026/02/7850f2c2-7bcf-4323-993c-f1664d543810_975x456.png)
Introduction
Welcome to Week 10 of Learning Mixpanel. I’m Ansh, a Mixpanel Certified Partner. I’ve had the privilege of working with 60+ startups, helping them set up their analytics infrastructure and gain actionable insights using Mixpanel.
Curious about my work? Check out my website for case studies, testimonials, and more details about what I do.
Tired of Mixpanel data going wrong - events missing, properties breaking, or random spikes?
Pravix makes it simple to detect these issues and keep your data clean.
Today, I’m going to talk about how to track user retention in Mixpanel.
Let’s get into it
If your preferred consumption is audio visual - access the video on Youtube
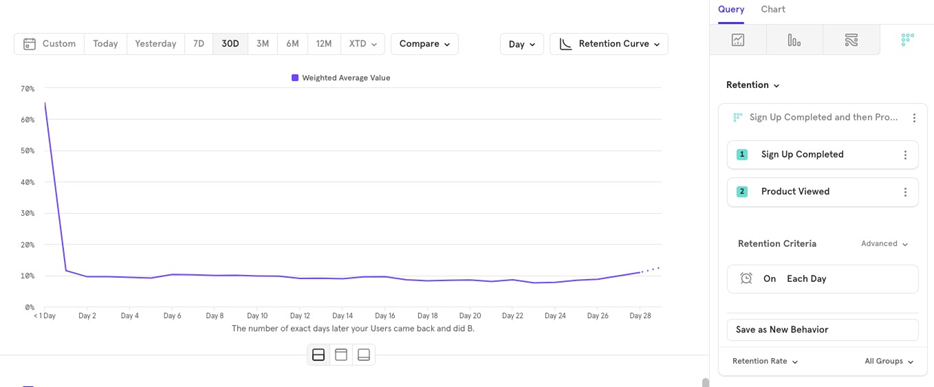
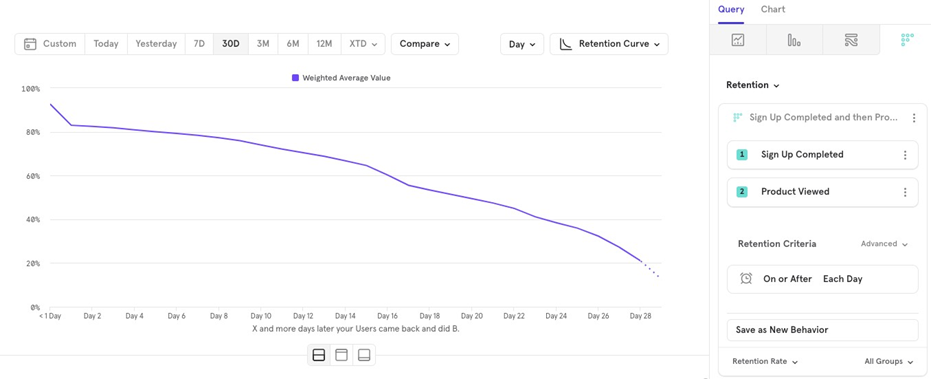
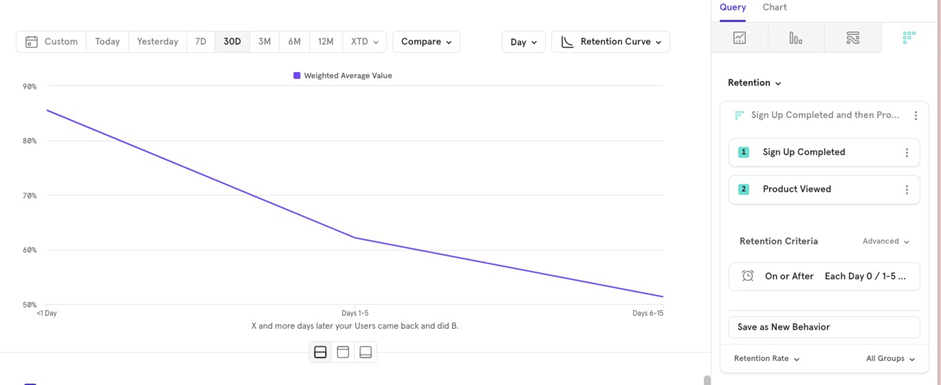
In Mixpanel, Retention helps you understand if users perform Event A (trigger event) and then return to perform Event B (recurring event) within a certain time period.
For example, you might want to track users who sign up Event A and then view a product Event B on a daily basis.
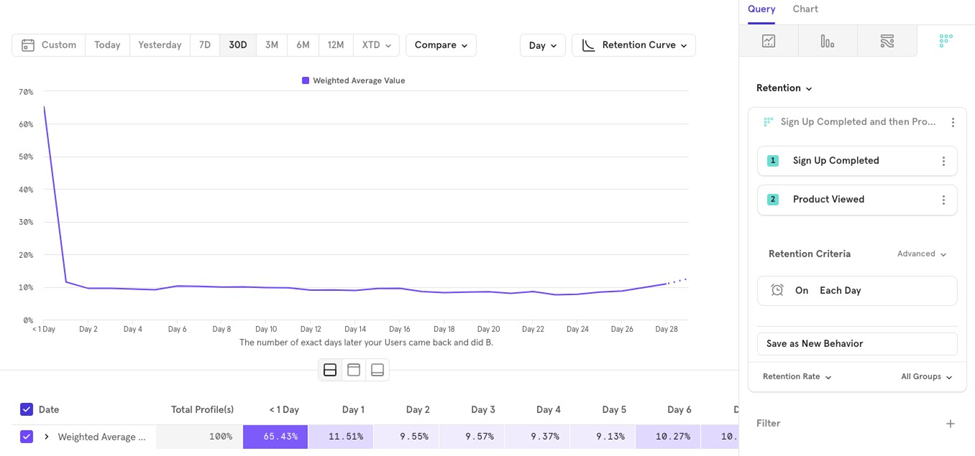
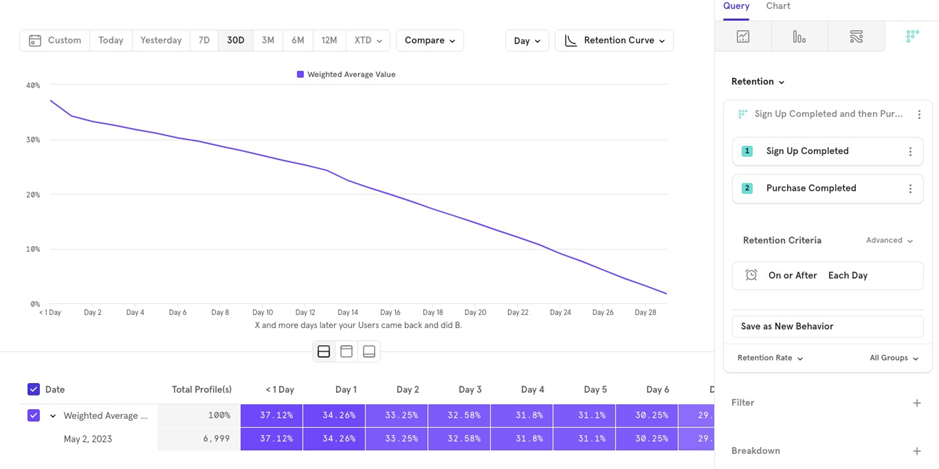
The values for “1 Day”, “Day 1”, and so on in the retention chart are weighted averages measured across the selected time period.
For example, if you’re looking at data for the last 30 days grouped on a Day level, Mixpanel calculates how many users signed up on each day and then checks how many came back to view a product on 1 Day, Day 1, etc.
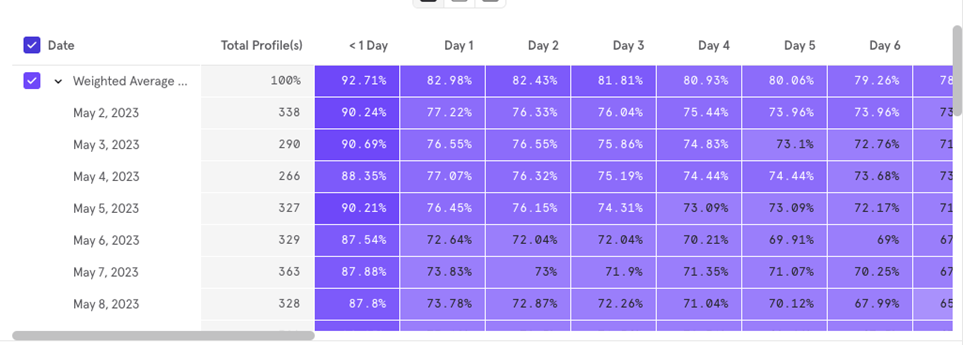
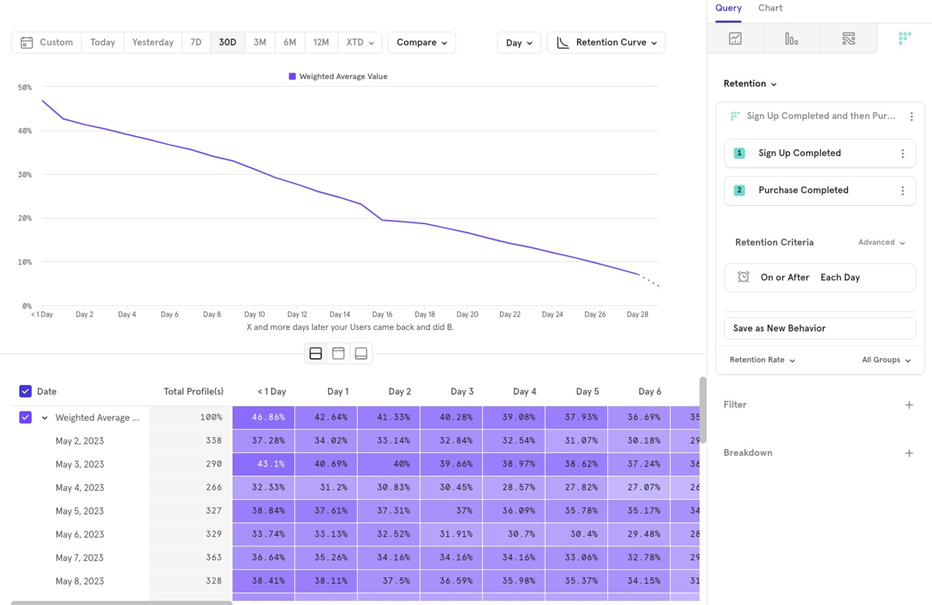
Example:
- On May 2, 2023, 338 users signed up, and 198 of them viewed a product within 1 day. The 1 Day retention for May 2 would be 58.58%.
- This calculation is repeated for each day (e.g., May 3, May 4 and for each retention group 1 Day, Day 1, etc.).
Finally, a weighted average (only for completed buckets) is displayed on the retention chart.
Weighted average calculation
Mixpanel calculates the weighted average using only completed buckets, weighted by the number of users who did the first event. Hereʼs an example:
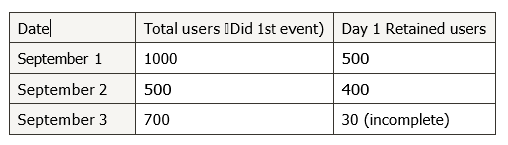
Step 1 Calculate Weights for Each Day
- September 1 Weight 1000 / 1000 500
- September 2 Weight 500 / 1000 500
Step 2 Calculate Weighted Average of Retained Users
Weighted average of retained users 500*1000/1000500 400*
500/1000500
Step 3 Calculate Weighted Average of Total Users
Weighted average of total users 1000*1000/1000500 500*500/1000500
Step 4 Compute Weighted Average Retention
Weighted average retention Weighted average of retained users / Weighted average of total users
In this case, the weighted average retention is 56%.
Retention Reports Have 4 Key Parts:
- Metric
- Retention criteria
- Measurement
- Chart Type
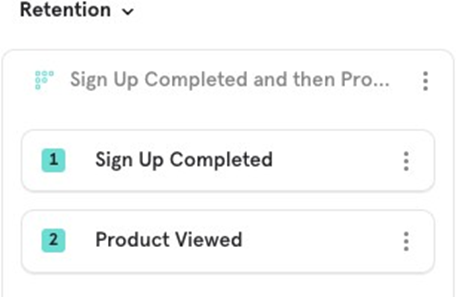
Metric
In retention reports, you need to select two metrics (events):
- The first event builds the user base.
- The second event is the retention event that users must perform to be considered retained.
Example: You want to see what percentage of users sign up and then keep coming back to view a product in your app.
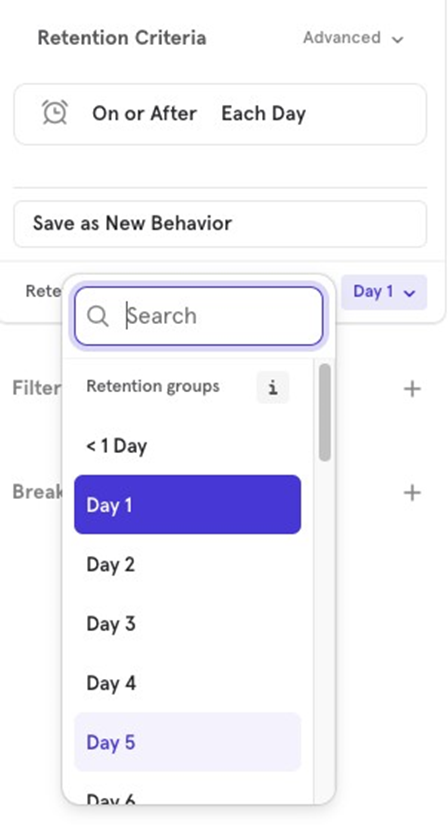
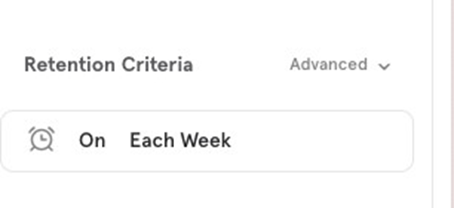
Retention Criteria
Retention Criteria allows you to define how retention is calculated, including the time frame (grouping) for measuring retention (e.g., daily, weekly, or monthly).
This helps you determine how often users should return to perform the retention event after the initial event to be counted as retained.
Retention Calculation
Mixpanel offers four types of retention calculations. Letʼs say youʼre tracking retention from Sign up Completed to Product Viewed on a weekly basis.
Hereʼs how each calculation works:
- On or After Tracks the percentage of users who return on a specific time period or after. A user signs up on May 1st but only views a product in the 2nd week. This user will be counted as retained for both Week 1 and Week 2.
On Tracks the percentage of users who return on the specific time period. A user signs up on May 1st and views a product only in Week 2. This user will be counted as retained for Week 2 but not for Week 1.
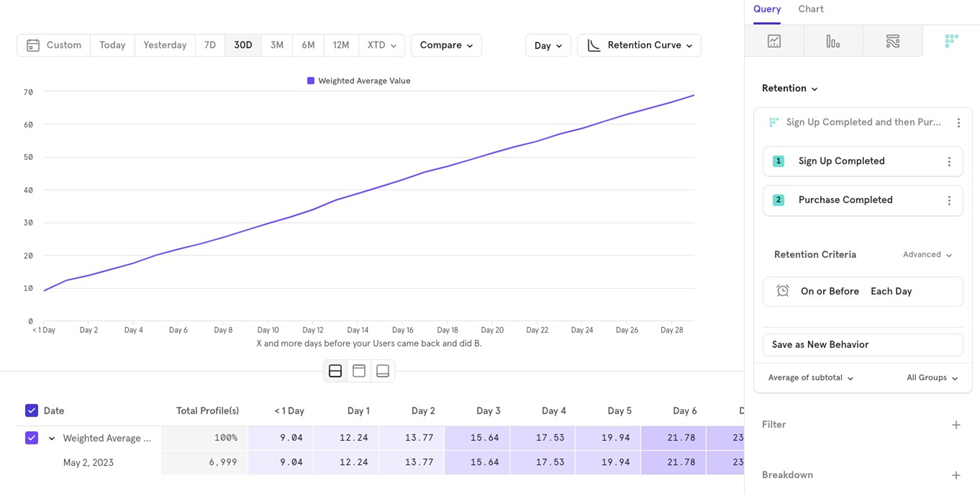
- On or Before Helps track all user activity between the start and end event. Example: To calculate
30-day ARPU (average revenue per user), youʼd track Sign up Completed to
Product Purchased On or Before Each Day and measure the subtotal property as an average. The chart would show ARPU increasing over time.
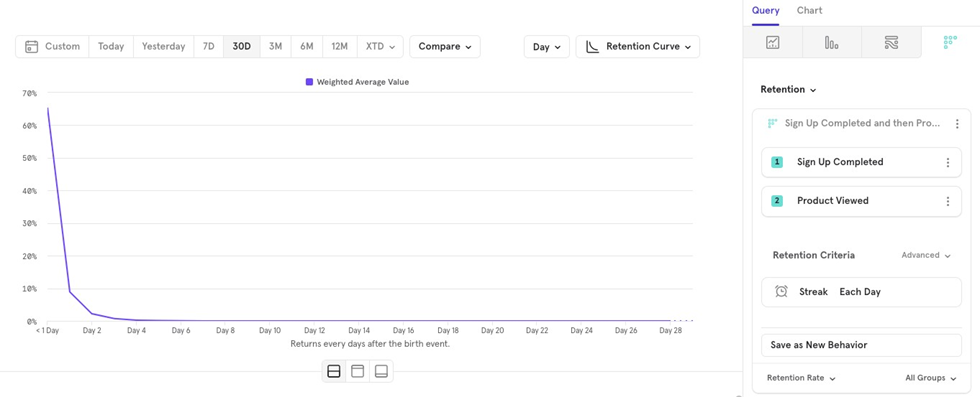
- Streak: Tracks users who maintain a streak by returning in every time period. A user signs up on May 1st but doesnʼt view a product in Week 1 or Week 2. They wonʼt be counted as retained for either week. If another user views a product in Weeks 1 and 2, skips Week 3, but returns in Week 4, theyʼll be counted as retained for Weeks 1 and 2 only.
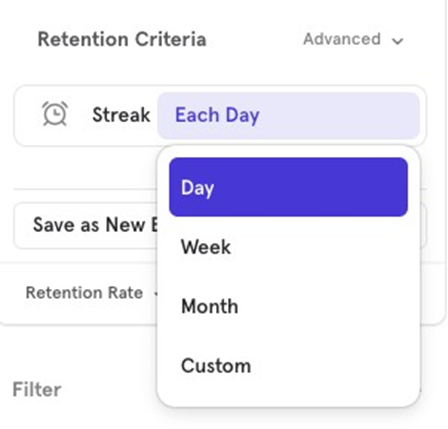
Retention grouping
You can calculate retention using different time frames: Daily, Weekly, Monthly, or a Custom retention bracket.
Letʼs use the example of Sign up Completed to Product Viewed (on or after).
- Daily Tracks users who return daily or on the next few days to view a product.
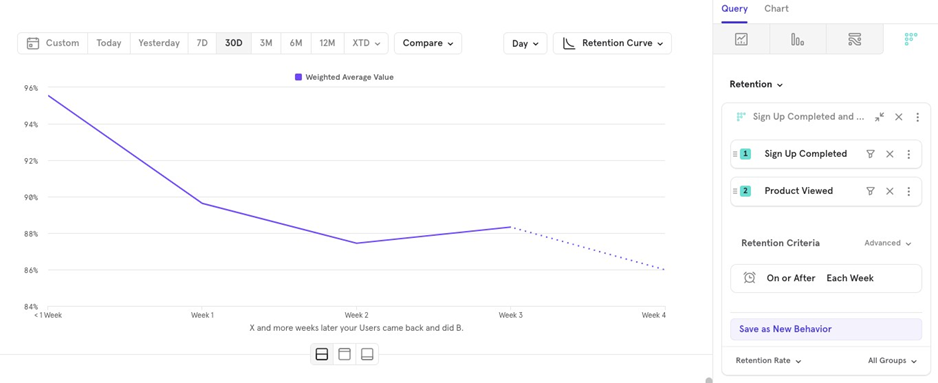
- Weekly Tracks users who return weekly or in the following weeks to view a product.
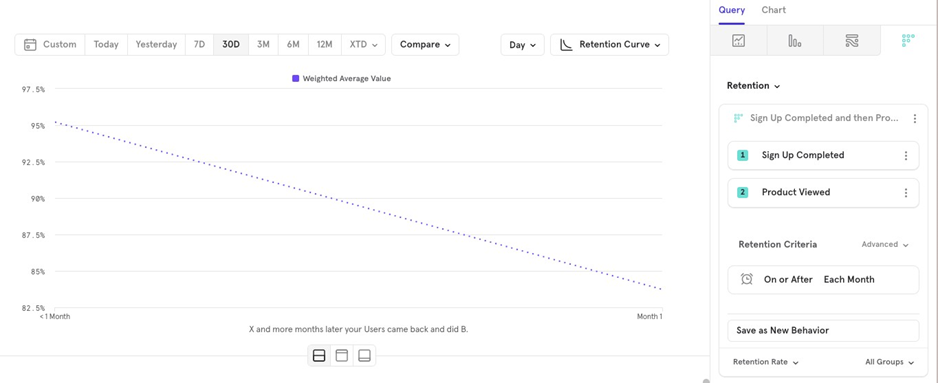
- Monthly Tracks users who return monthly or in the following months to view a product.
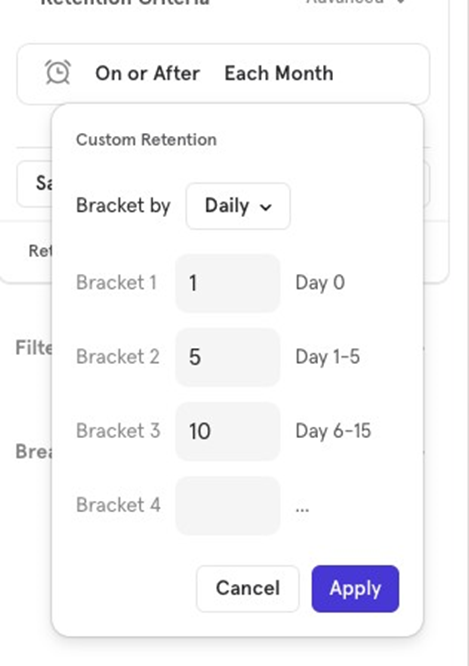
- Custom Allows you to create your own interval brackets.
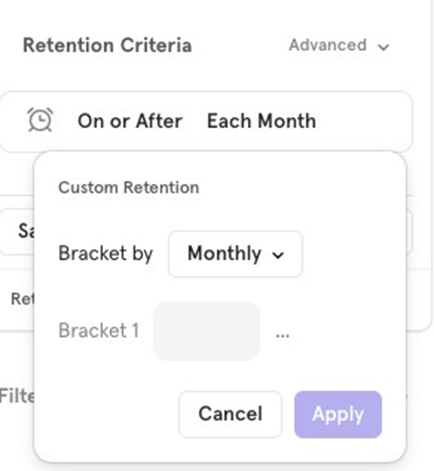
- You could define buckets like Day 0, 1-5 days, and 6-15 days. This would track users based on these specific time brackets, which is useful if your product doesnʼt follow a linear usage pattern.
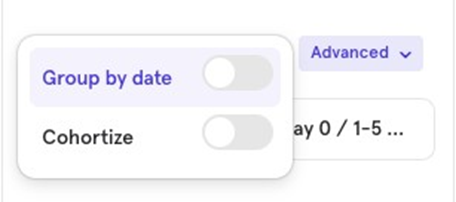
Group by Date
Instead of using default intervals (like 24 hours or 7-14 days), you can calculate retention based on calendar days, weeks, or months.
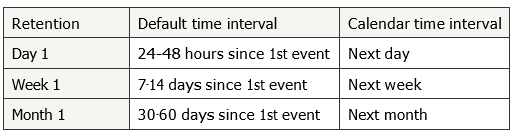
Examples:
- A user signs up at 7pm on Monday and purchases at 6am on Tuesday:
- Default Day 0 retention
- Calendar Day 1 retention
- A user signs up on Friday and purchases on the next Monday:
- Default Week 0 retention
- Calendar Week 1 retention
- A user signs up on September 29 and purchases on October 1
- Default Month 0 retention
- Calendar Month 1 retention
Cohortize
Cohortize groups users based on the first day they performed an event, allowing you to analyze retention rates for different user groups based on when they entered the retention funnel.
For example, if youʼre looking at a 30-day retention chart for users who completed Sign up and made a purchase, there are two ways to view the data:
Cohortized Retention: Take all users who signed up in the last 30 days and calculate how many were retained on Day 1, Day 2, and so on.
Overall Retention: Group users by the day they signed up (e.g., September 1, September 2, etc.), calculate retention individually for each day (e.g., Day 1, Day 2, and then calculate the weighted average retention. This is how Mixpanel calculates retention when Cohortize is enabled.
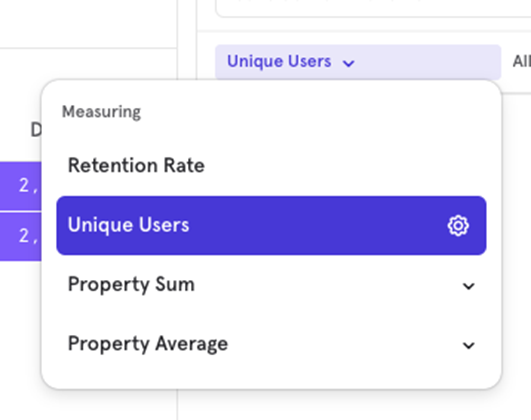
Measurement
This section allows you to choose what the retention chart should measure, as well as the chart type. Mixpanel supports four measurement types:
- Retention Rate
- Unique Users
- Property Sum
- Property Average
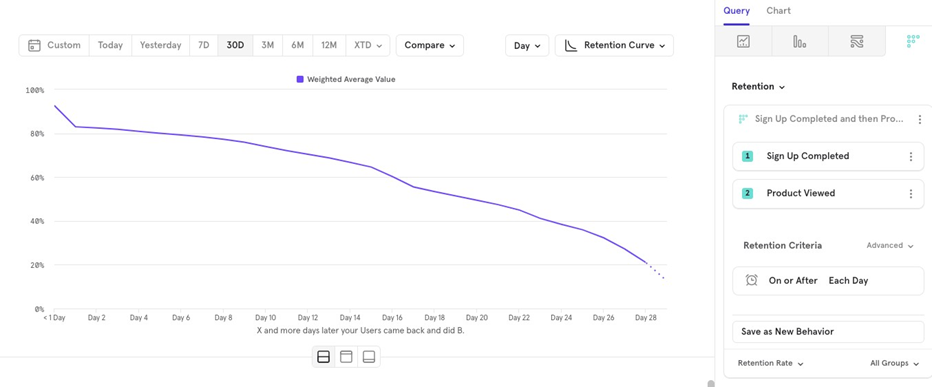
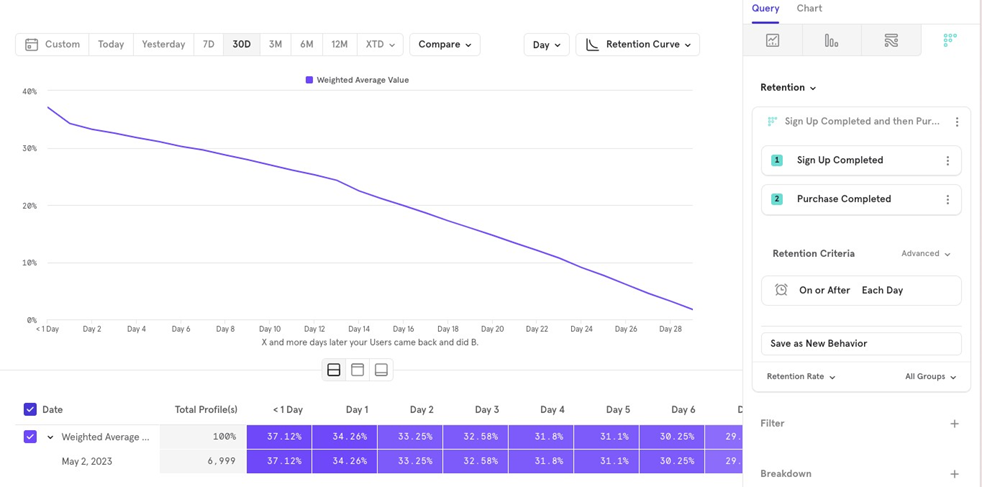
Retention Rate
This helps you understand how users are retained over time. For example, tracking how users who sign up return to make a purchase to be counted as retained. The retention criteria here is On or After Each Day.
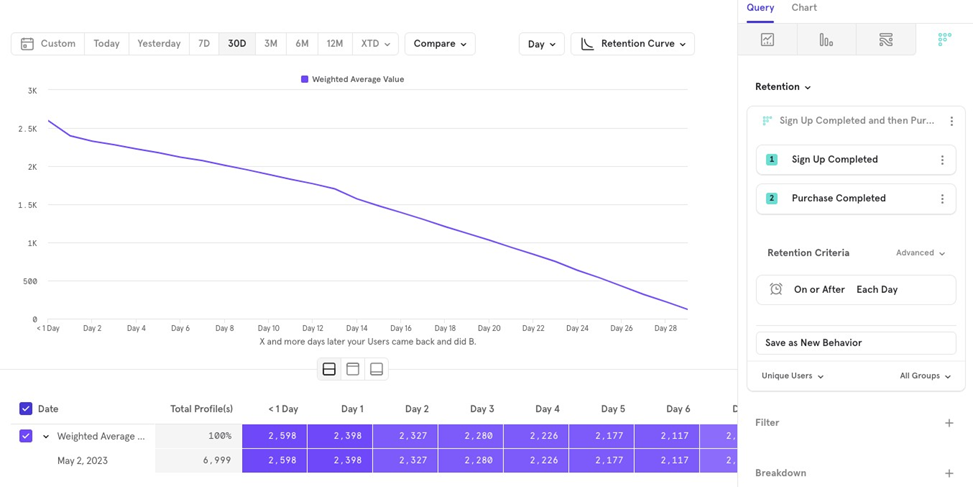
Unique Users
Tracks the absolute number of users retained on a specific day. For example, how many users came back on Day 16 after signing up to make a purchase.
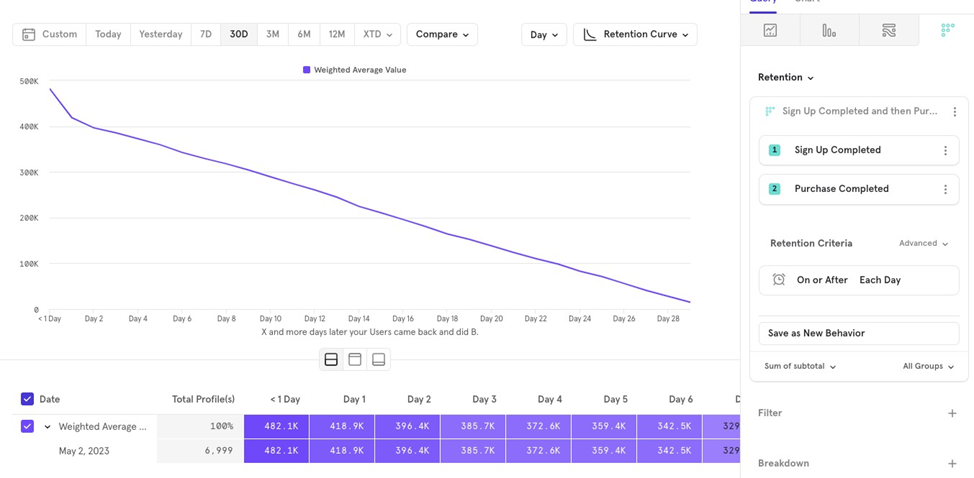
Property Sum
Shows how a propertyʼs total value retains over time. For example, you can track how much revenue is retained as users return, regardless of how many users make a purchase.
Property Average
Shows how a property’s average value per user changes over time. For example, tracking how the average order amount evolves as users spend more time on the app after signing up.
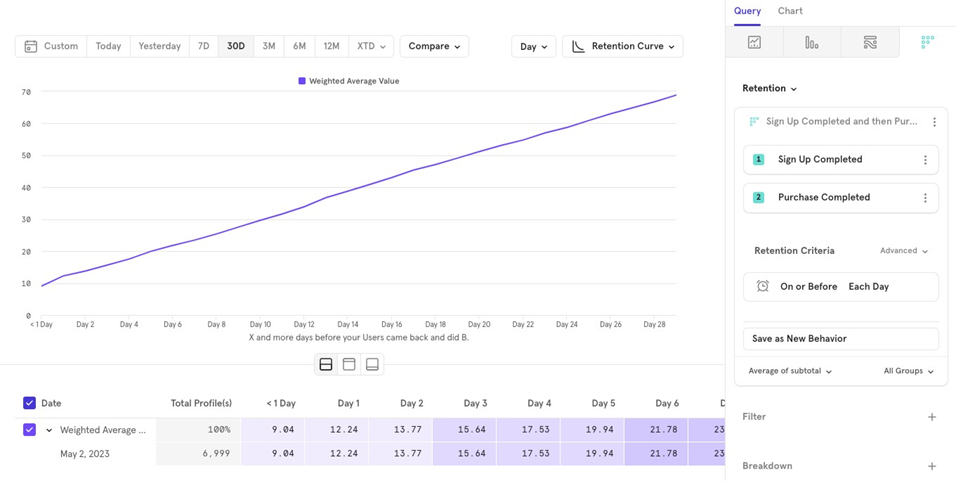
Here, we chose On or Before Each Day to see the average order value on Day 10 vs Day 30.
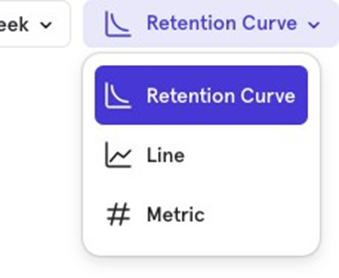
Chart Type
Retention reports offer 3 chart types:
- Retention Curve (what we’ve been looking at so far)
- Line
- Metric
Line Chart
The Line Chart in retention reports shows how retention for a specific time period changes over time. For example, you can track how Day 1 retention for Sign up to Purchase Completed has changed over the past 30 days.
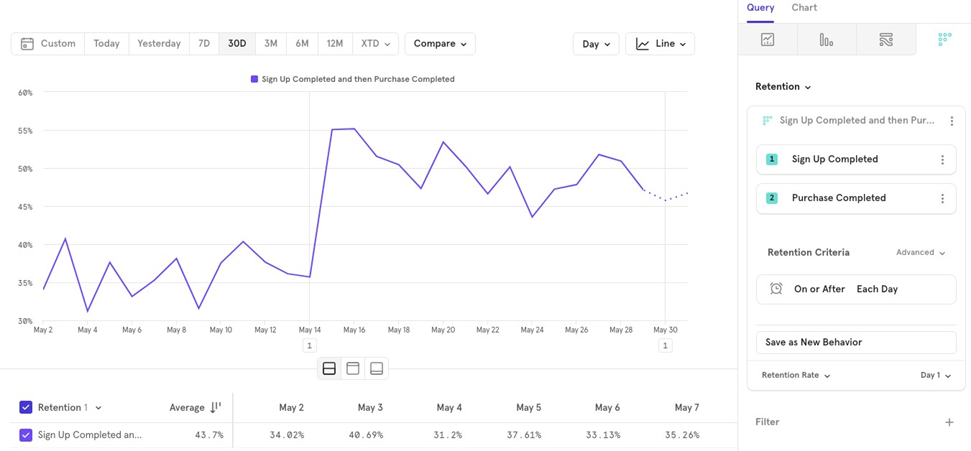
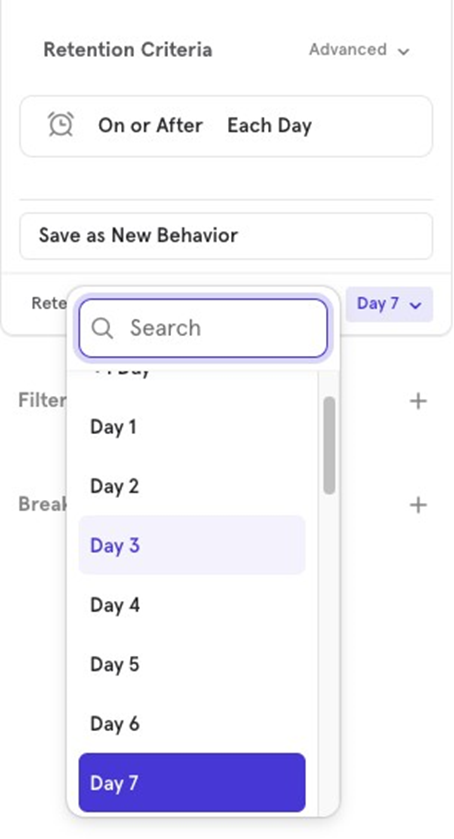
Unlike the retention curve, the line chart shows the value for only one time period (e.g., Day 1, Day 7 and tracks it over time.
Metric Chart
The Metric Chart summarizes retention for a specific period. For example, you can view the average Day 1 retention for Sign up to Purchase Completed over the past 30 days.
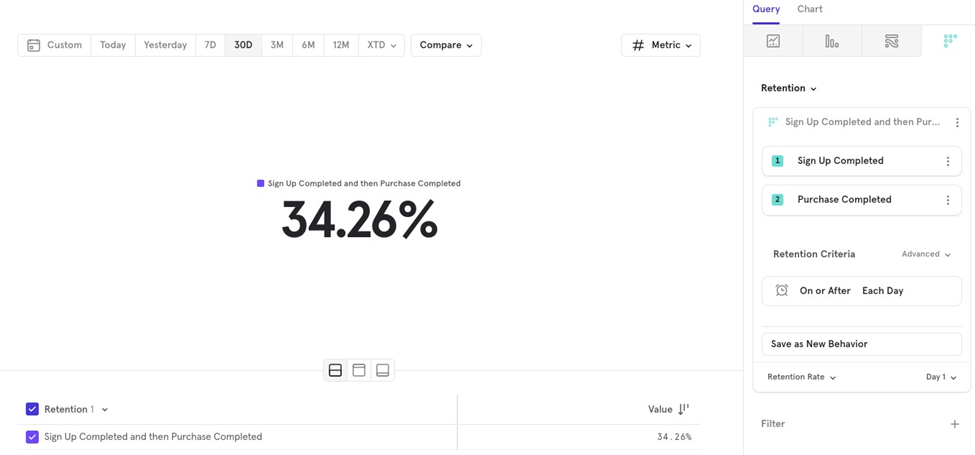
Similar to the line chart, you can choose the time period you want to analyze.