[Week 15] Learning Mixpanel: Mastering Flows with Mixpanel

![[Week 15] Learning Mixpanel: Mastering Flows with Mixpanel](https://storage.ghost.io/c/45/2a/452a1712-ece1-4f4c-bf40-52fdca4a4b7b/content/images/size/w1200/2026/02/da0be822-1e05-4463-8f2e-d5c00c2a76e4_968x657.png)
Introduction
Welcome to Week 10 of Learning Mixpanel. I’m Ansh, a Mixpanel Certified Partner. I’ve had the privilege of working with 60+ startups, helping them set up their analytics infrastructure and gain actionable insights using Mixpanel.
Curious about my work? Check out my website for case studies, testimonials, and more details about what I do.
Tired of Mixpanel data going wrong - events missing, properties breaking, or random spikes?
Pravix makes it simple to detect these issues and keep your data clean.
Today, I’m going to talk about how to use flows in Mixpanel
Let’s get into it
If your preferred consumption is audio visual - access the video on Youtube
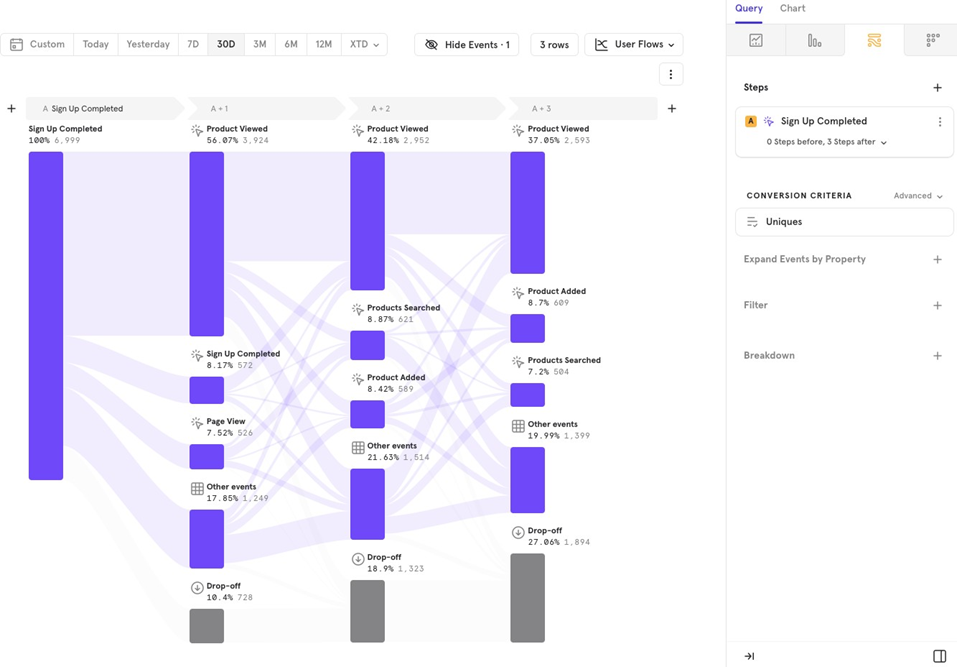
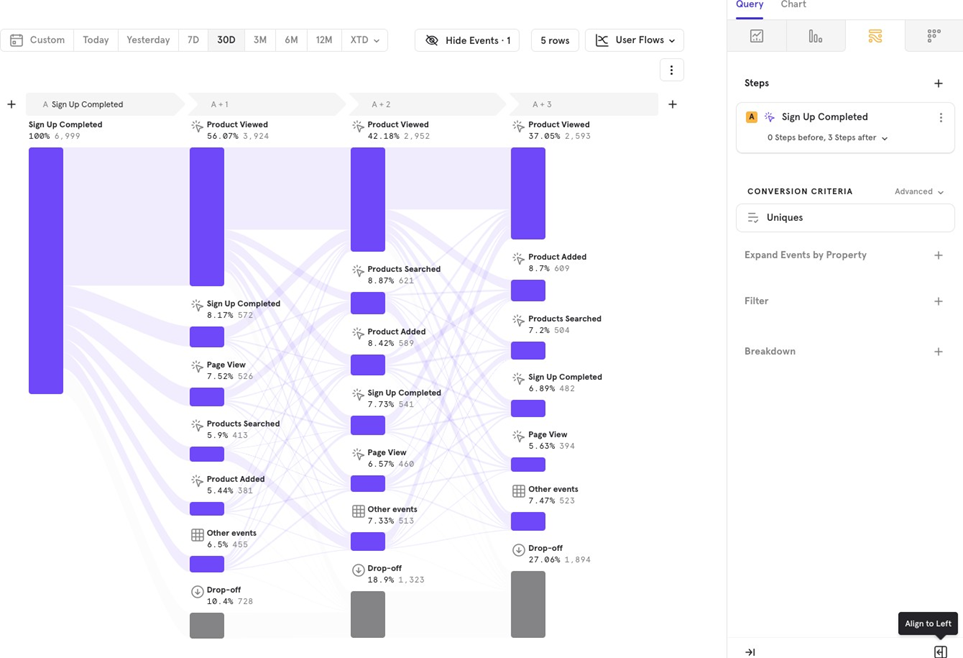
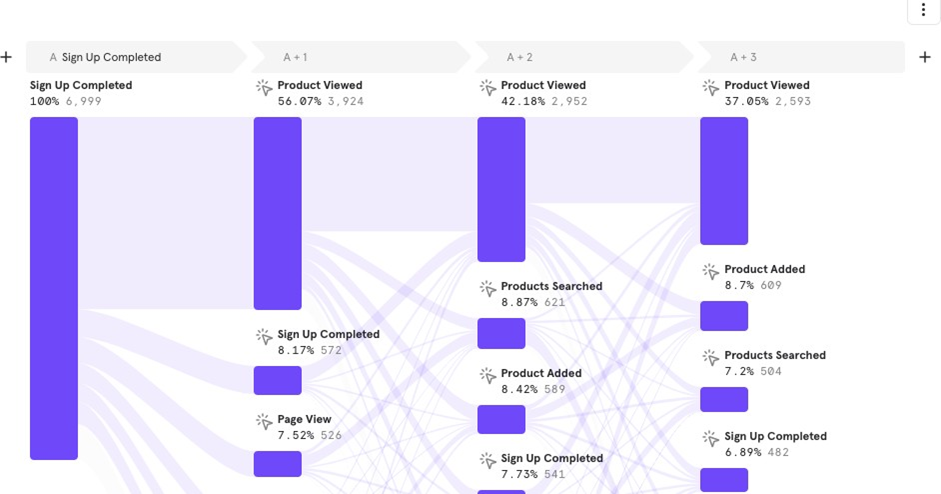
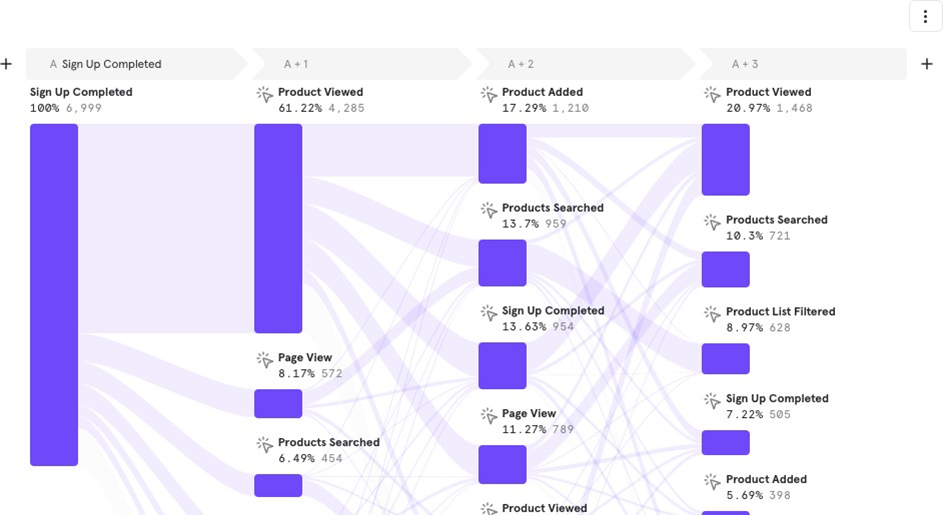
Flows help you understand user paths before, after, or between events. You can see the top paths users take to reach a specific event.
For example, you can explore what users do after making a purchase.
The Flows report has 3 key parts:
- Metric
- Conversion criteria
- Chart Type
Metric
Here, you choose:
- Event: The event you want to analyze.
- Before or After Whether you want to see steps before or after the event (or both).
- Number of Steps How many steps you want to analyze.
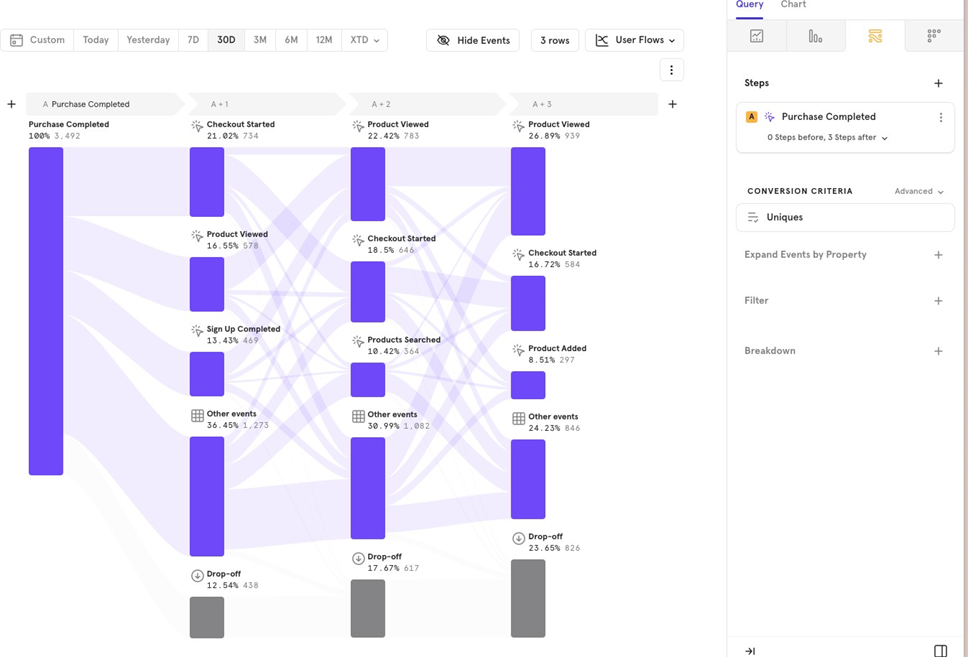
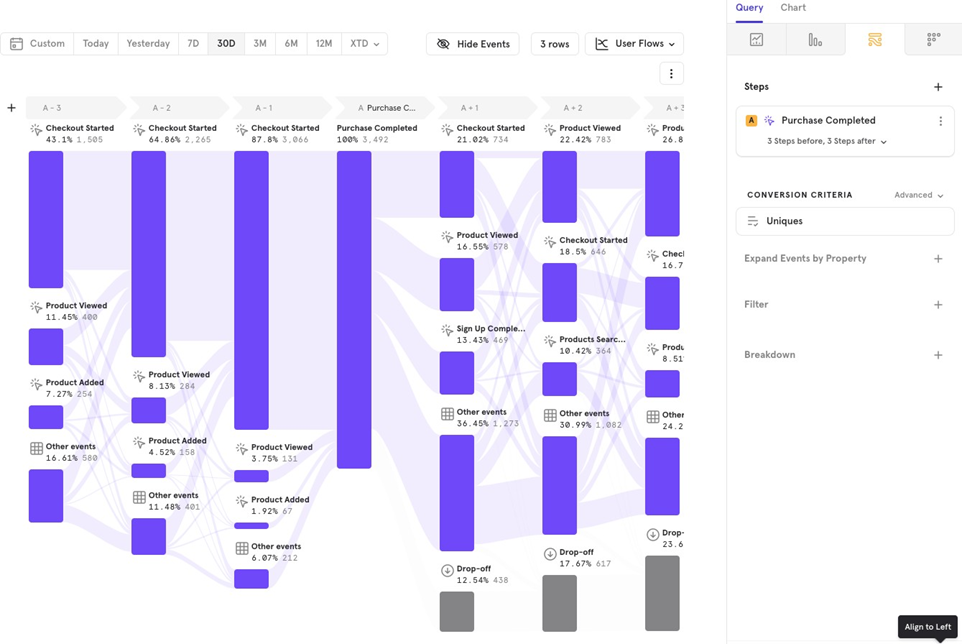
Example: You want to see the last 3 steps users take before making a purchase and the first 3 steps after.
Choosing multiple events
You can also look at steps between two events instead of just before or after one event.
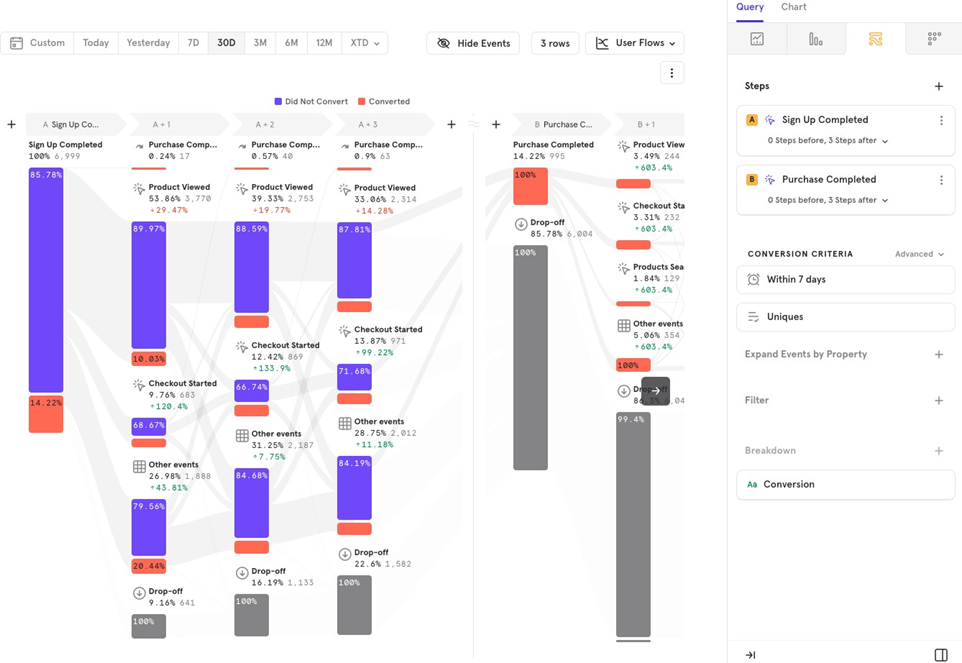
Example: You want to track users who completed Sign up, see their next 3 steps, and then understand how these users reach the Purchase Completed event. This helps identify steps users are likely to take to complete a purchase.
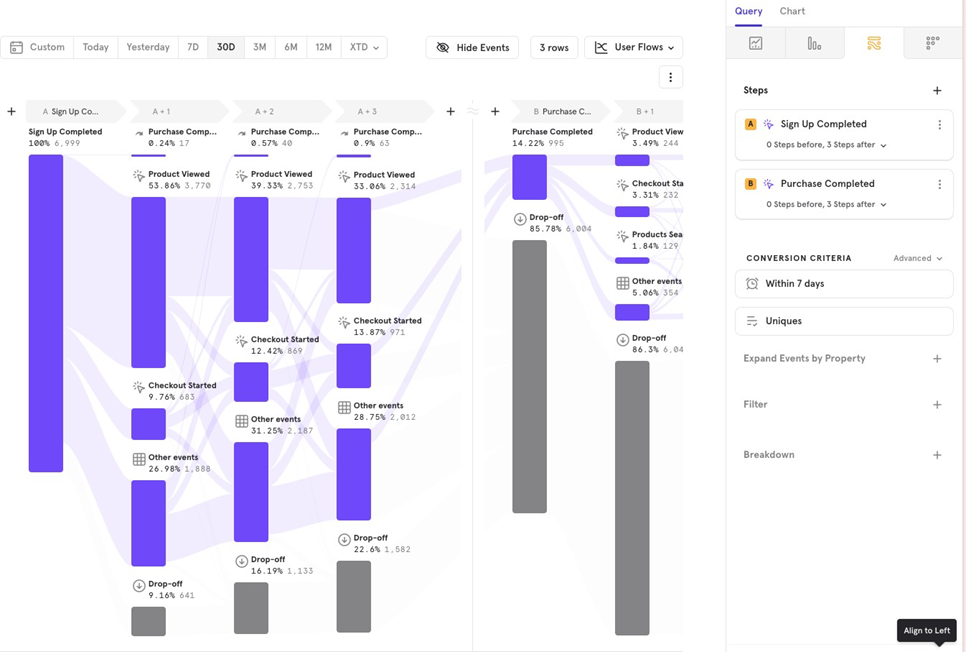
In this case, Flows act like a funnel, calculating how many users move from Event A to Event B, then detailing their steps.
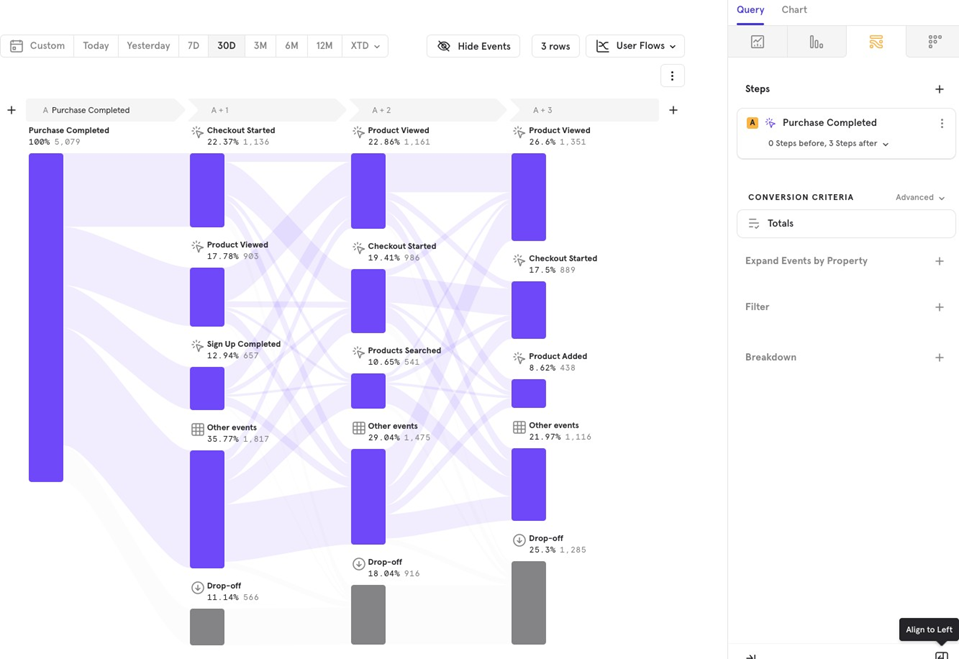
Conversion Criteria
In Conversion Criteria, you can choose to analyze by Users, Total Events, or Sessions, and set specific conversion conditions when analyzing single/ multiple (works in a different way for single vs multiple events) events.
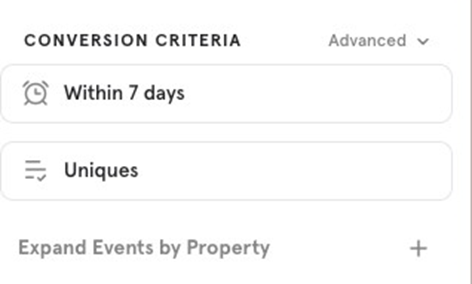
Single Event
For a single event (before or after), Mixpanel counts by Unique Users by default. You can change this to Total Events or Sessions.
Example: If you want to analyze the steps users take after every purchase, switching to Total Events will give you a clearer picture of actions taken after each purchase, not just on a user level.
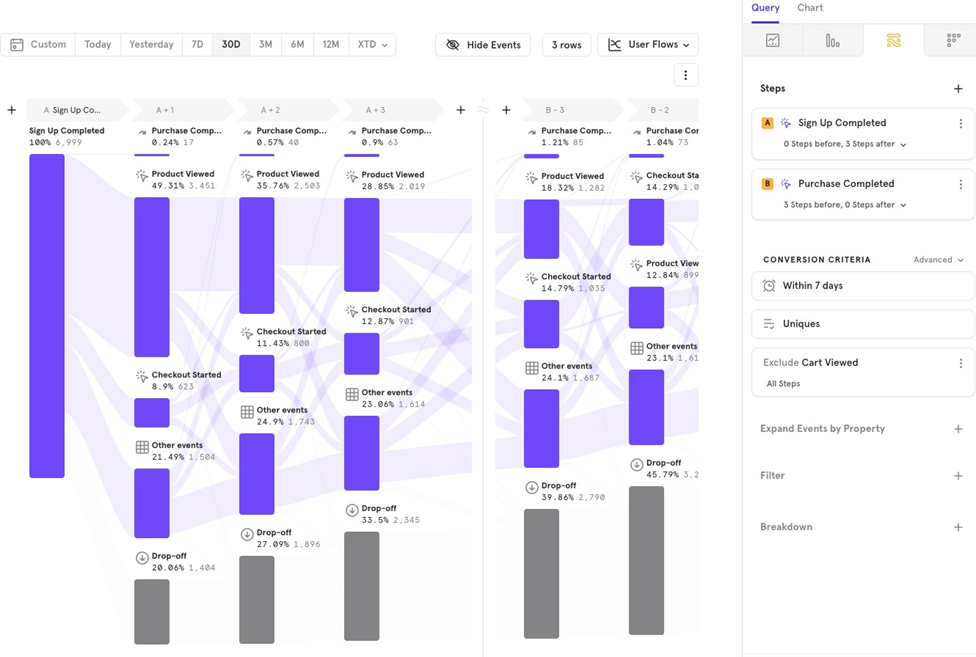
Multiple Events (funnel)
For multiple events, Mixpanel treats flows as funnels, offering more funnel-related features:
- Time Period Set a time limit for users to complete Event B after Event A.
- Counting Method Default is Users, but you can switch to Total Events or Sessions.
- Exclude Users You can exclude users who performed a specific event between Event A and Event B.
- Holding Property Constant Ensure that users who move through the funnel maintain a specific property across events.
Example: You want to analyze Sign Up Completed to Purchase Completed but exclude users who viewed a cart, and ensure purchases are made within 7 days of signing up.
Expand Events by Property
Expand Events by Property allows you to break down an event by a specific property for deeper insights.
Example You want to see the steps before a purchase and break down Checkout Started by the search engine to understand which search engine drives the most conversions.
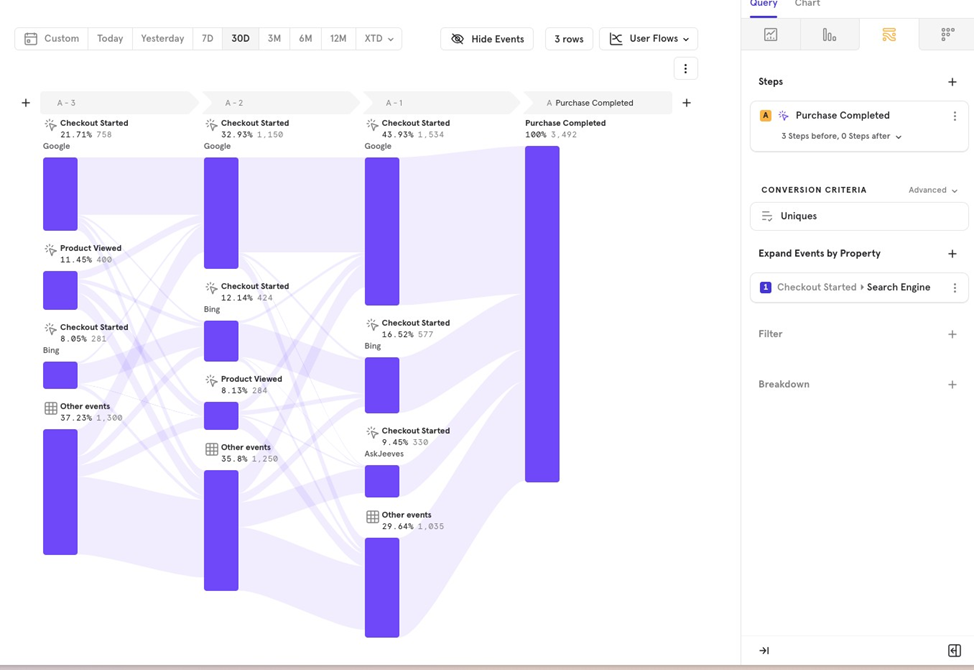
Chart Type
In Flows, there are two chart types:
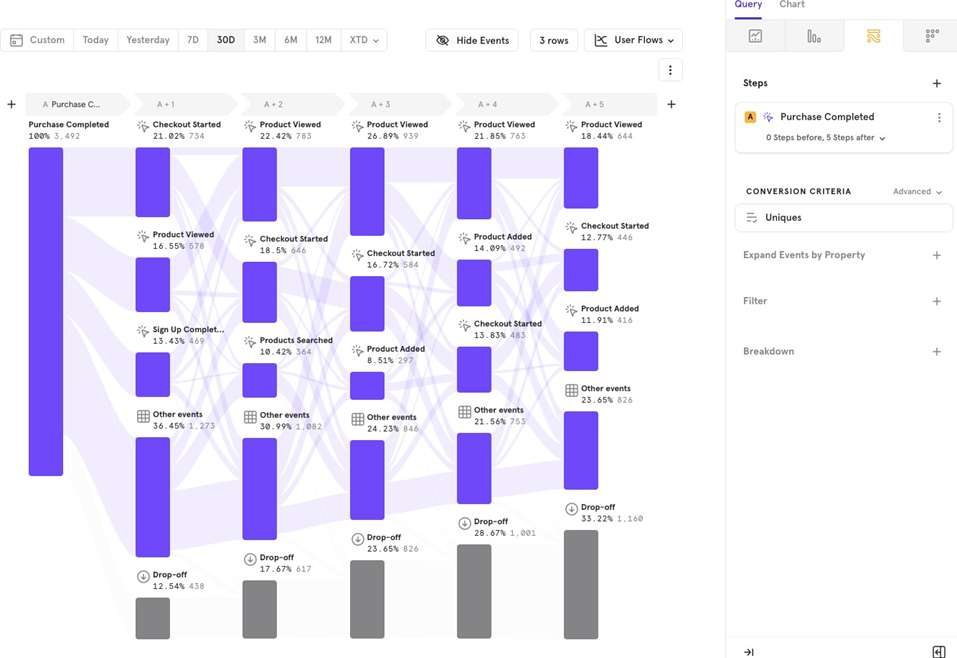
- User Flows: Shows the paths users take before or after performing a specific event.
- Top Paths: Displays the most common paths users take before or after an event.
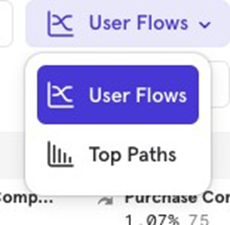
User Flows
Use User Flows to see the steps users take after completing an event, such as after making a purchase.
Top Paths
Use Top Paths to see the most common paths users take after an event, such as after signing up.
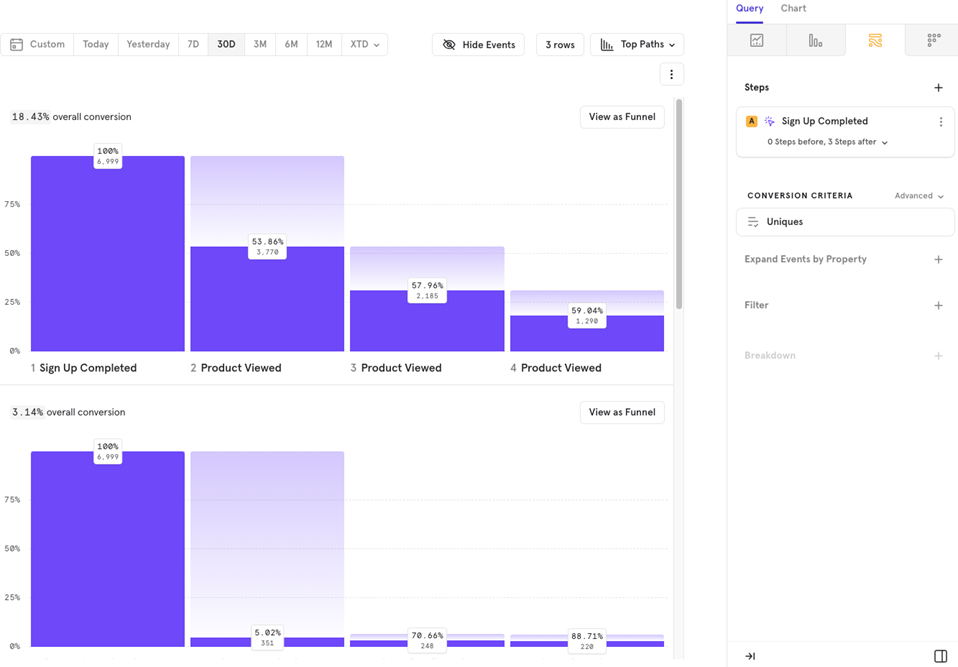
You can also dive deeper into specific paths by clicking View as Funnel, which will take you to the Funnels report for that flow.
Additional features of Flows
Flows has several customization features that allow you to tailor the report to your needs. Let’s explore them one by one.
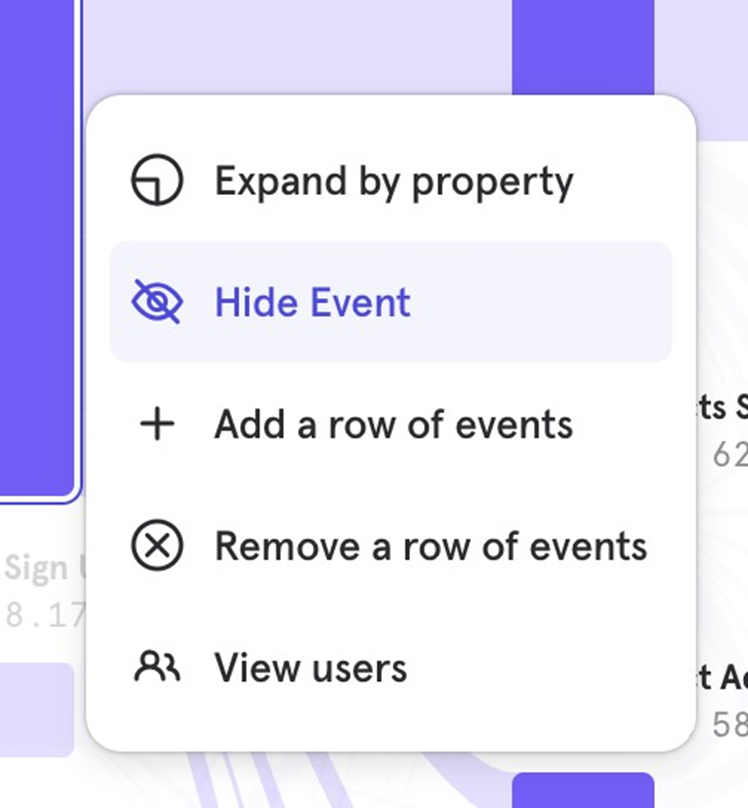
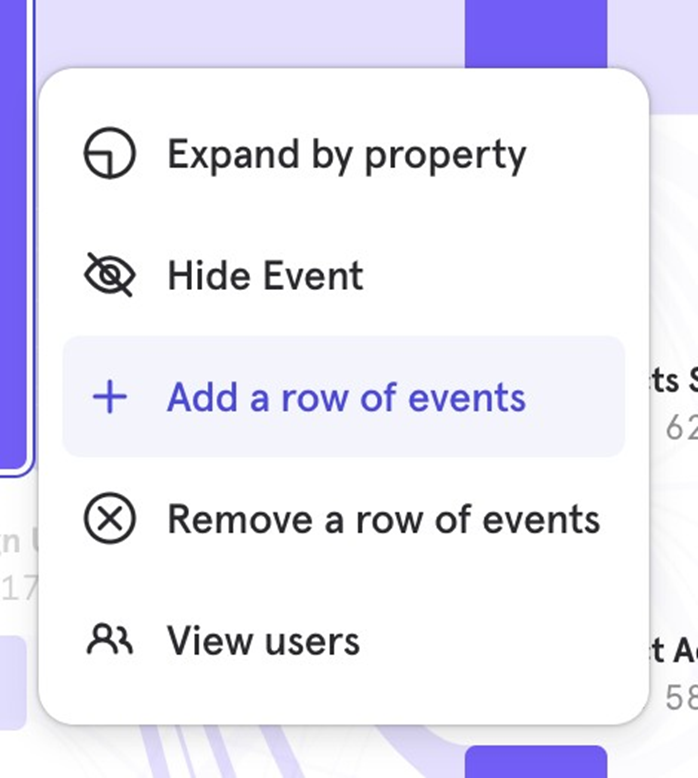
Hide Events
You can hide specific events from the Flows report if you’re not interested in seeing them.
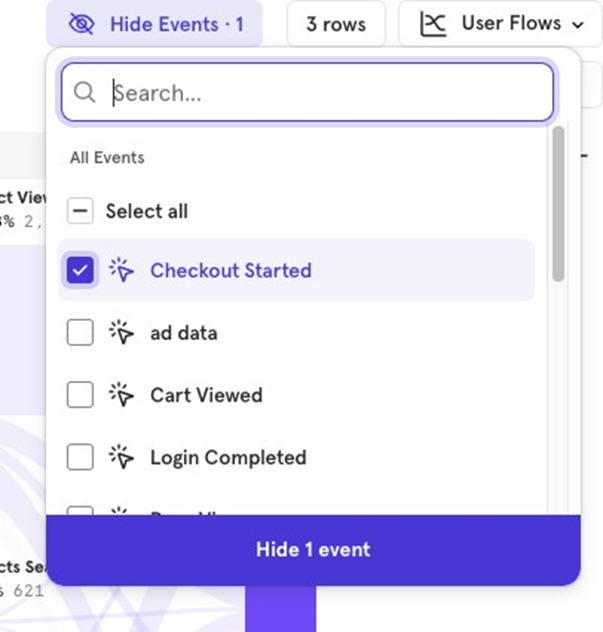
You can also hide events by clicking directly on an event.
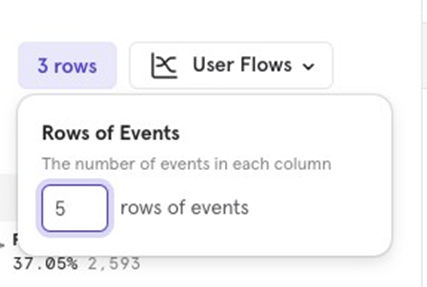
Rows of Events
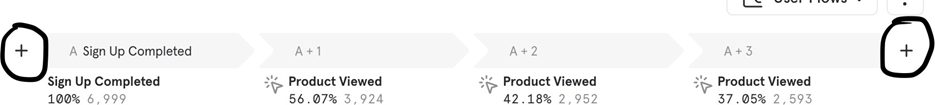
You can adjust the number of rows shown in the flow. The default is 3 rows, but you can change this to show more or fewer rows.
You can also add/ remove a row of events by clicking directly on an event.
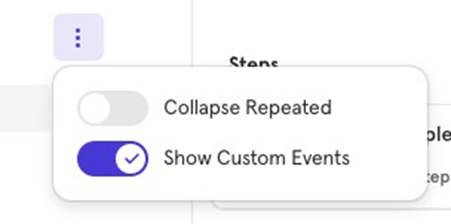
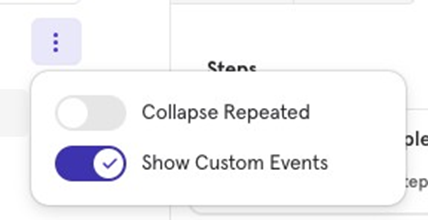
Collapse Repeated
This feature collapses repeated back-to-back events into one, making it easier to focus on other events in the flow.
Before
After
Show/ Hide Custom Events
You can choose whether to display or hide custom events within the flow.
Adding/ Removing steps
You can easily add or remove steps directly from the Flows UI to adjust the analysis.
Breakdown by Conversion
This feature helps you analyze flows by comparing users who converted versus those who didnʼt. For example, you can track the flow from Sign Up to Purchase Completed for both converted and non-converted users.