Connecting marketing and product data

The short version
Your marketing site and your product live on two subdomains, and most companies never join the data between them. So you can see cost per visitor by channel, but not which channel brings users who signup, activate, retain, and pay. That second number is the one that should decide your budget, and it is sitting in two systems that are not connected.
This article covers what the connected picture looks like, why you cannot trust the ROAS Google and Meta report, how to stitch identity across www and app in Mixpanel, PostHog, Amplitude, and the one table you should read every week.
Why are your marketing site and product two disconnected halves?
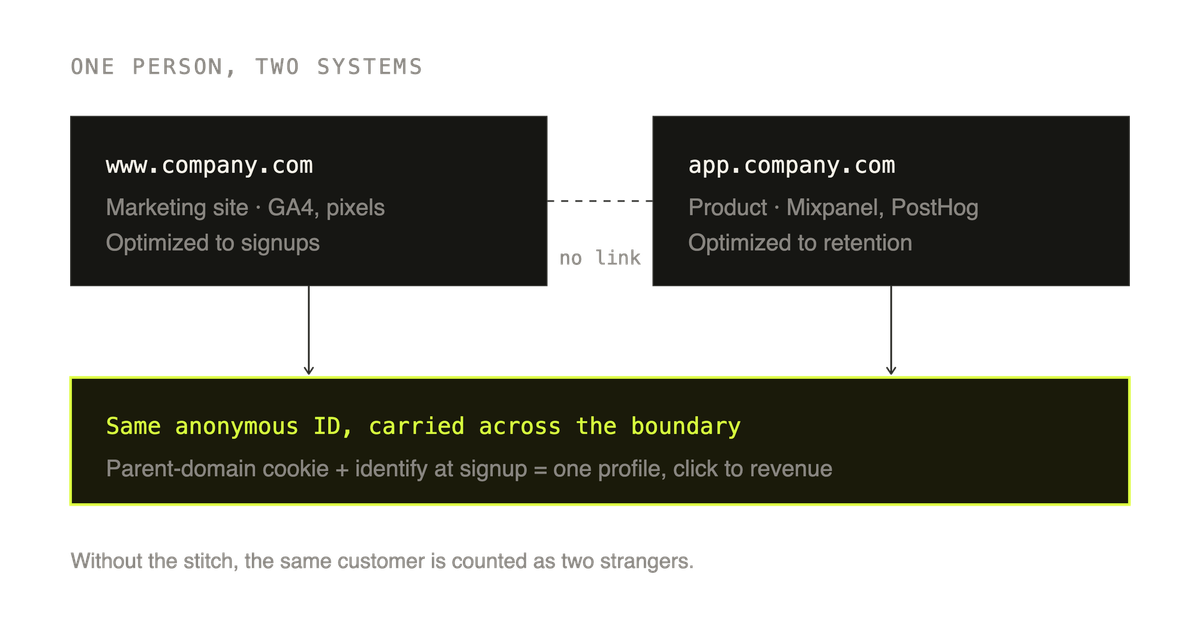
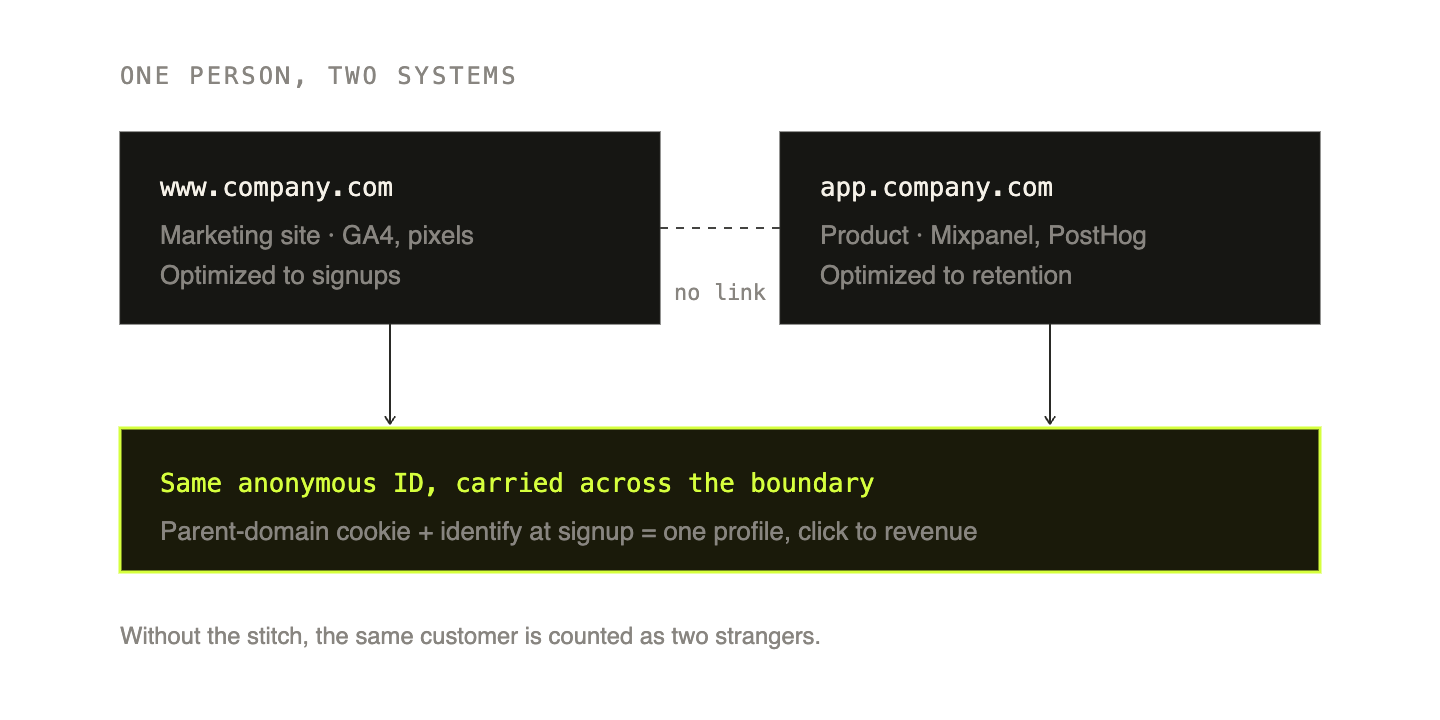
The setup is the same almost everywhere. The marketing site on www.company.com runs GA4, a Meta pixel, a Google Ads tag, all optimized around one number: visitors to the website. The product on app.company.com runs Mixpanel or PostHog or Amplitude, optimized around activation and retention.
For the user it is one company and one journey: see the ad, read the page, sign up, use the product. The data captures it as two disconnected halves, because the marketing stack stops watching the moment the user leaves www, and the product stack picks them up on app as a fresh anonymous visitor with no memory of where they came from.
So marketing optimizes to visitors, because that's the last thing it can see. That's bad. Signups are cheap and most are worthless, and a channel can be your best on cost per signup and your worst on revenue at the same time. Nobody in the company can finish the sentence "a Google Search click is worth X in ninety-day revenue and a Meta click is worth Y" with real numbers.
What does the connected picture look like?
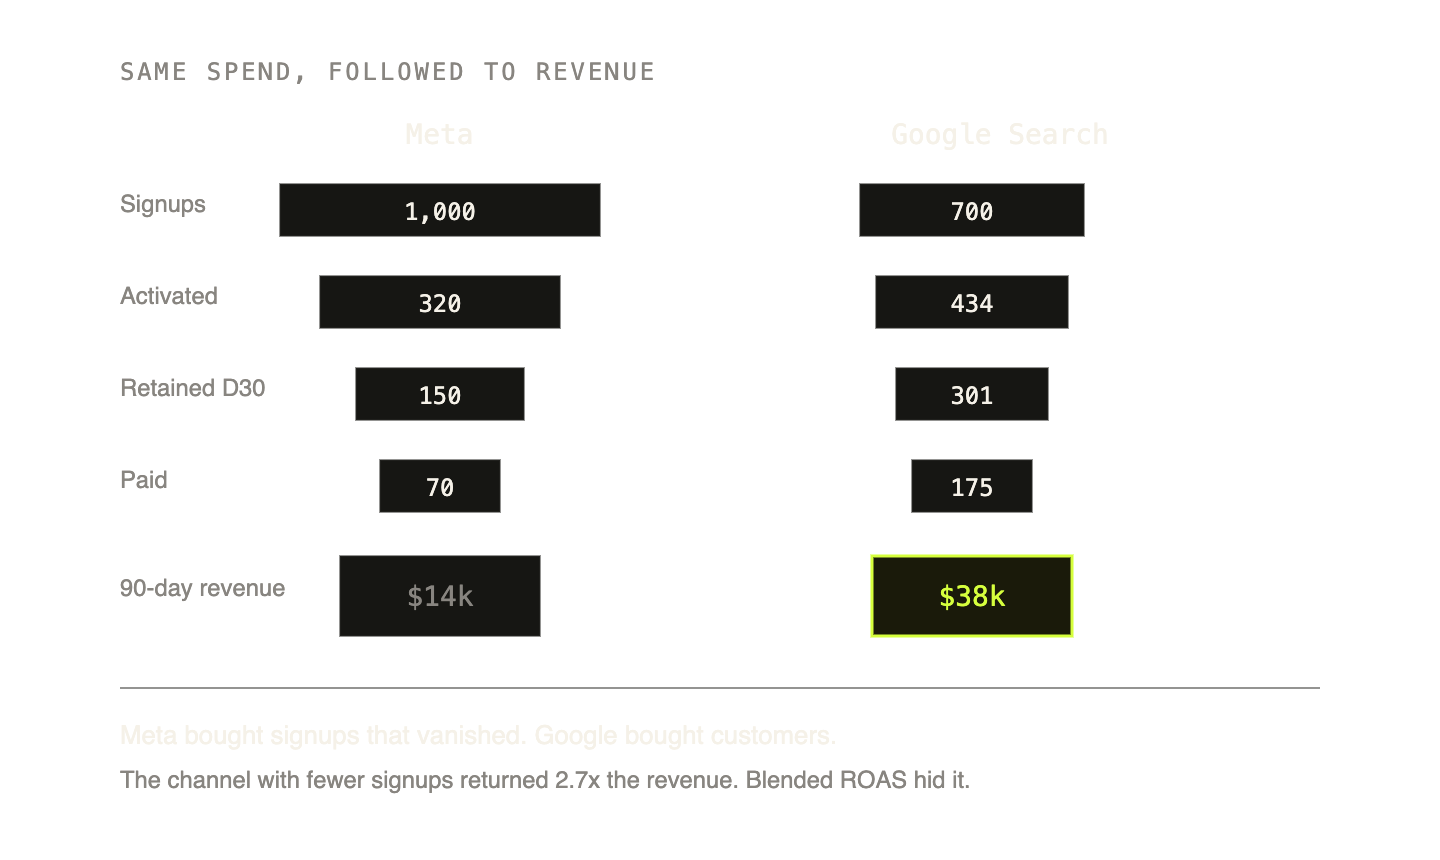
You run Google Search and Meta. On the platform dashboards they look comparable, maybe Meta a little cheaper per visitor. Join the data across the boundary and cohort users by the channel that actually brought them: Google converts to signup at a lower rate, but those signups activate at nearly twice the rate, retain far better at thirty days, and convert to paid at more than double. Meta was buying visitors that vanish.
The blended ROAS the platforms showed you was hiding that composition. Meta's cheap signups dragged your cost per visitor down and your real return down at the same time.
And this works below the channel level. Which campaign brings users who activate, which creative brings tourists, which keyword brings someone still paying six months later. You stop optimizing the ad account to clicks and signups and start optimizing to revenue from customers who stay.
Why can't you trust the ROAS Google and Meta report?
You cannot just read this off the Google Ads and Meta dashboards.
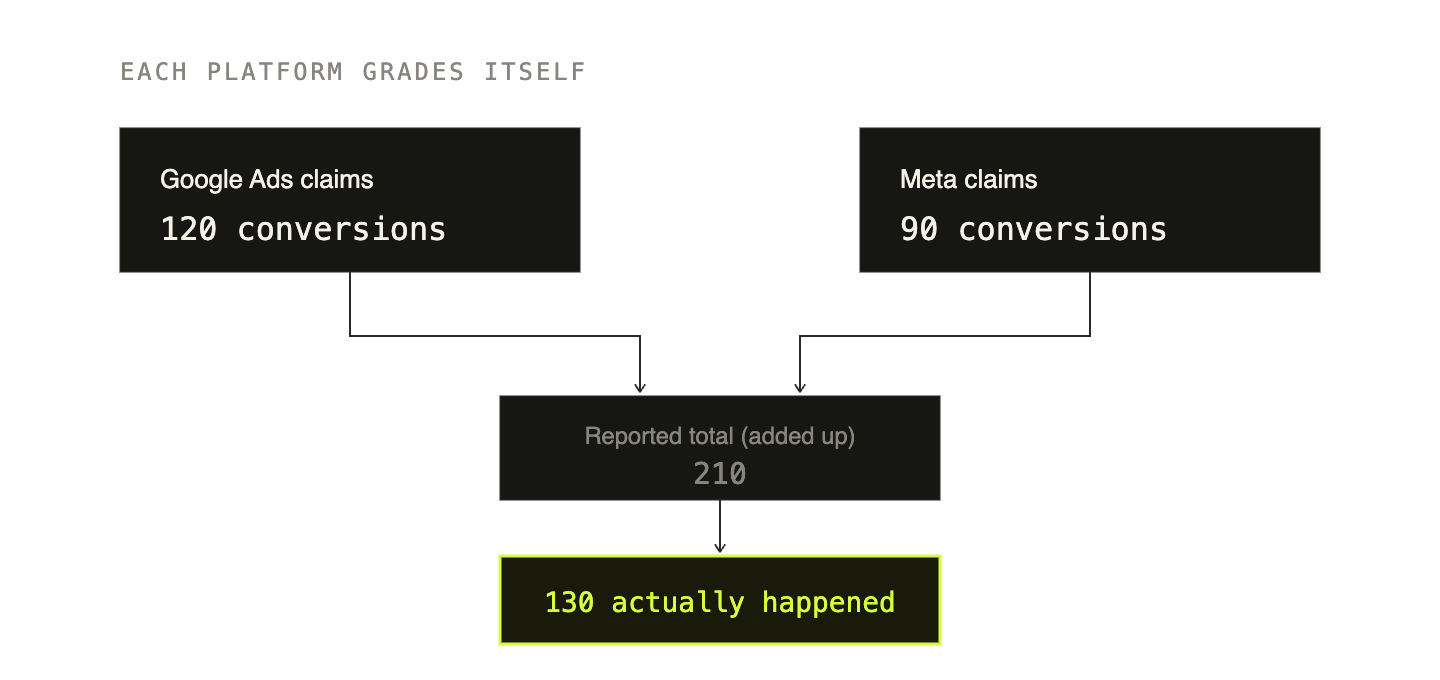
Both platforms are graded by the same companies selling you the clicks, and both want credit for the conversion, so both count generously and both count the same conversions. Add up what each claims it drove in a month and you often get more conversions than you actually had.
The worst offender is view-through: a user scrolls past your ad, never clicks, comes to your site some other way, and converts, and the platform counts it because the ad was served. Last-click has the opposite failure, handing everything to the final touch and erasing every touch before it. Neither tells you what caused the conversion.
The one-line version is all you need. Trust your spend, because it is real and you paid it. Do not trust the ROAS reported on top of it. The only honest return number is the one you compute yourself, from users you can follow from click to cash. Which brings us to how you follow them.
How do you stitch identity across www and app?
This is an identity problem and a tooling one. The same person is one anonymous ID on www and a different anonymous ID on app, and nothing links the two. Fix that and everything downstream falls into place. And make sure to use the same analytics tool on www and app.
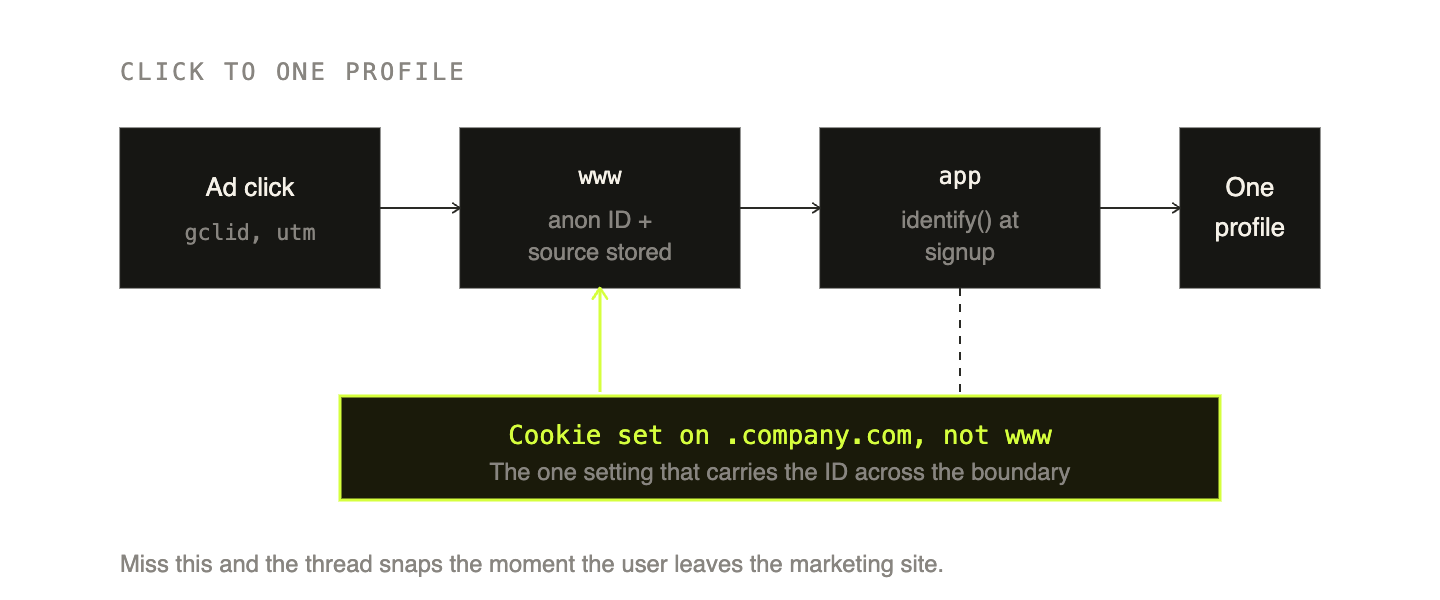
The foundation is a cookie set at the parent-domain level. Set your analytics identity cookie on .company.com instead of www.company.com and that cookie is readable on every subdomain, so the anonymous ID a visitor gets on the marketing site survives the jump to the app. This is the single most important setting and the one most people get wrong by default.
Then two more things. Capture the acquisition context on the marketing site and hold it: UTM parameters and click IDs, gclid from Google and fbclid from Meta, plus the newer wbraid and gbraid Google now uses. Store these as first-touch properties the moment the user lands, before they ever sign up. And call identify at signup with your real user ID, usually their database ID or email. That merges the anonymous marketing history into the known user, so every event from the first pageview through payment hangs off one profile with the original source stamped on it.
Now the tool differences, because this is where people get burned assuming all three behave the same. Mixpanel and PostHog both default to a cross-subdomain first-party cookie, so out of the box the anonymous ID already carries from www to app, and PostHog even captures the initial UTM values as person properties as long as you are on its default cookie-backed persistence. Amplitude is the exception. Its browser SDK defaults to storing identity in localStorage, which is walled off per subdomain, so anonymous users are not shared across www and app unless you switch it to cookie storage or pass the device ID in the URL. Same outcome is achievable, but the default silently breaks the exact thing you are building, and you will not notice until you go looking for stitched journeys that are not there.
One honest limit. A parent-domain cookie stitches the same browser on the same device, not across devices. See the ad on your phone, sign up on your laptop, and the cookie cannot connect those sessions, because they never shared a cookie. The only real fix for cross-device is a deterministic identifier the user carries, which means login: once they are logged in on both devices, identify ties the sessions on your user ID regardless of cookies. Everything before login on a second device is a gap. It is smaller than you fear when click and signup happen in the same session on the same device, but it is not zero, and anyone claiming perfect attribution is not counting it.
What's the one table you read every week?
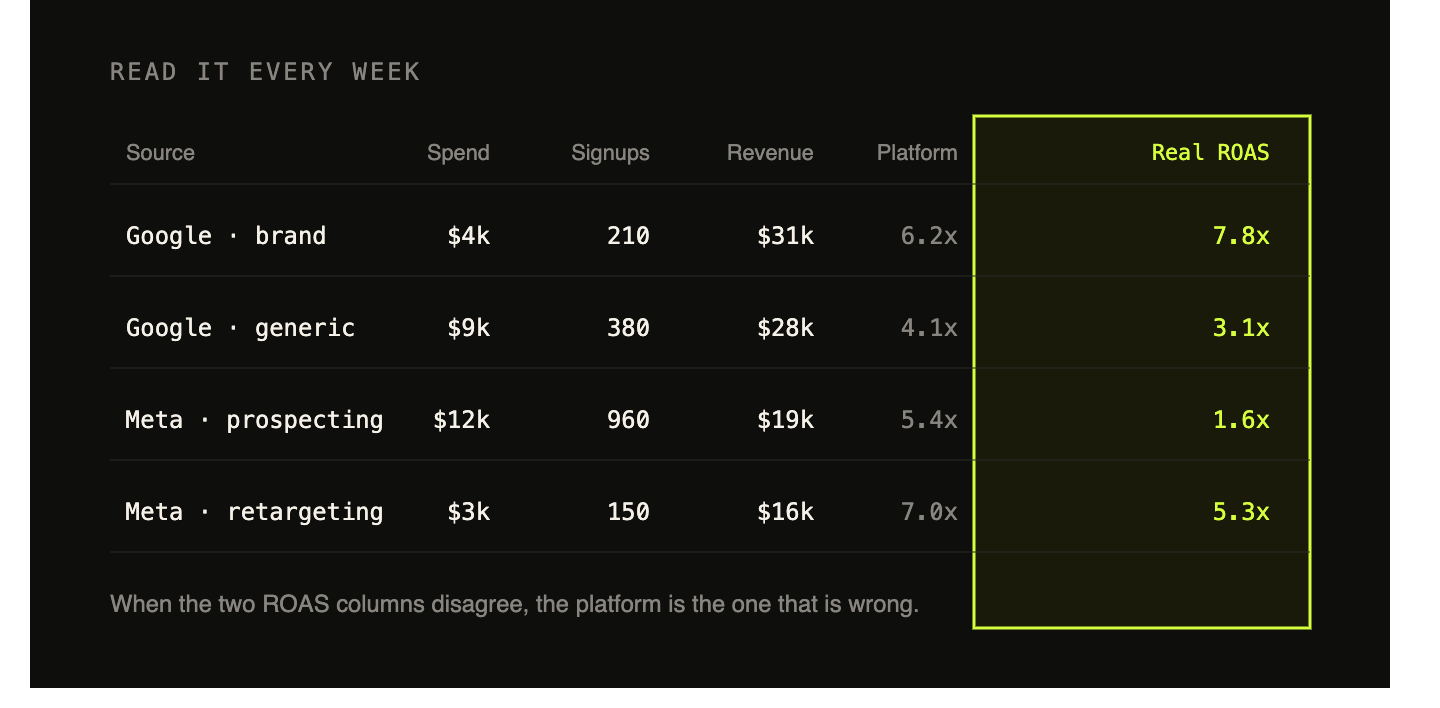
All of this pays off as a single table you read weekly to decide where money moves.
Rows are your ad sources, broken down as far as useful: channel, then campaign, then ad. Columns are the full journey. Spend, pulled from the ad platforms, because that is real. Then signups, activation rate, retained users at thirty days, and revenue, all from your own stitched data. Then the columns that actually drive the decision, the ones you can only build because you stitched: real cost per activated user, ninety-day revenue per signup, and your actual ROAS, computed from cash you can trace to users you can follow.
That last column flips decisions. Next to what the platform reported it will regularly disagree, and when it does, the platform is wrong. A channel the platform calls a winner shows up as expensive tourists; a channel that looked mediocre shows up as your best revenue per dollar. The platforms become places you pull spend from and push budget into, not places you go for the truth.
Stitch the identity, build the table, read it weekly, move budget toward strong real ROAS and away from weak, at the campaign and ad level. That is the loop, and it answers the only question worth asking about a channel: not how many people it sends you, but how much each of them is worth.
Frequently asked questions
Why don't my marketing site and product share data?
They're on two subdomains, and the anonymous ID set on www is a different ID from the one set on app. Nothing links them. For the user it's one journey — see the ad, read the page, sign up, use the product. The data captures it as two disconnected halves.
What goes wrong when they're disconnected?
Marketing optimises to visitors, because that's the last thing it can see. Signups are cheap and most are worthless, so a channel can look excellent on cost per visitor while delivering users who never activate and never pay.
How do you stitch identity across subdomains?
Set your analytics identity cookie at the parent-domain level — .company.com rather than www.company.com — so it's readable on both. Then capture the acquisition context on the marketing site and carry it through: UTM parameters and click IDs, gclid from Google and fbclid from Meta.
Why is view-through attribution the worst offender?
A user scrolls past your ad, never clicks, arrives some other way and converts — and the platform counts it as its own. Both Google and Meta want credit for the same conversion, and both are graded by the companies selling you the clicks.
What table should you actually look at?
Rows are ad sources broken down as far as useful — channel, then campaign, then ad. Columns are the full journey: spend from the platform, through to activation and revenue from your product data. That last column flips decisions, and when it disagrees with the platform, the platform is wrong.
Want this on your own stack?
Datalyze rebuilds your data foundation, then finds the growth it's been hiding — proven across 150+ startups.
Book a free analytics audit →