


Reporting, analysis & insights
Datalyze turns your Mixpanel, Amplitude or PostHog data into answers. We build the dashboards each team will use, dig into the numbers to find what is going on and why, and help you run the experiments that move them.
























From trusted data to decisions
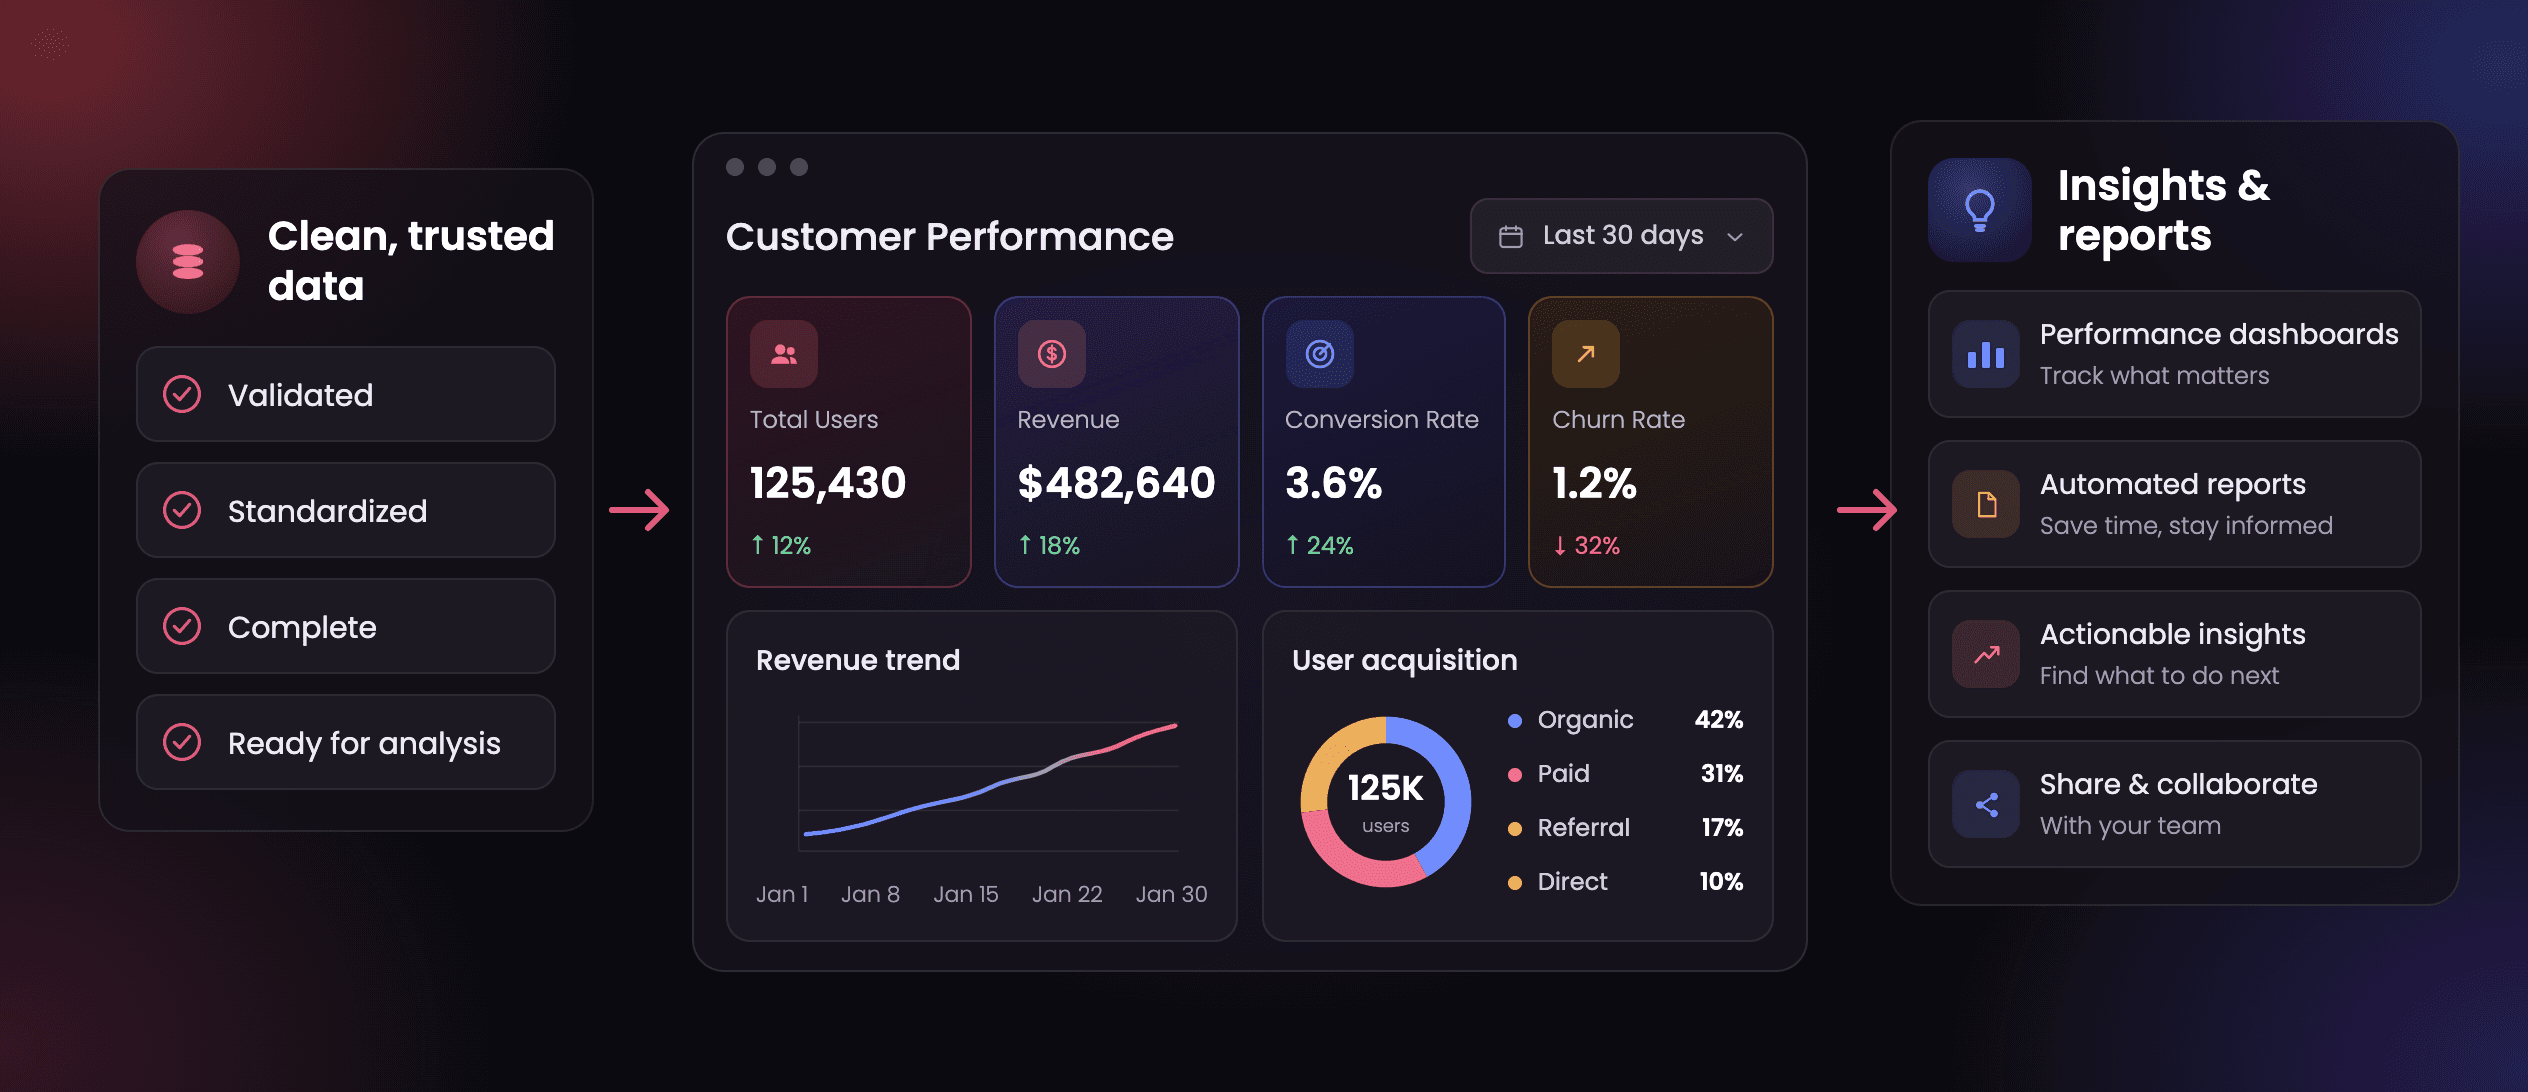
What reporting and analysis includes
- 01Dashboards
Dashboards each stakeholder will use
Founders, product, growth and marketing need different views. We build each team the dashboard that answers their questions.
- 02Priorities
Decide problems and priorities
We sit down with you and list the problems worth solving and the questions worth answering.
- 03Analysis
Find what's happening, then why
We go deep into the data to see where users drop, churn, watch session replays to understand what & why it happens.
- 04Experiments
Hypotheses, experiments and improvements
Each finding becomes a hypothesis. We help you design and run the experiment that tests it, read the result, and suggest the improvement to ship next.
- 05Alerts
Alerts across events and properties
Sudden drops in sign-ups, spikes in errors, events that stop firing. We set up alerts to know what went off.
- 06Ad-hoc
Ad-hoc analysis and number pulling
A board deck, an investor update, a quick question in Slack. We pull the numbers and run the one-off analysis, so your team doesn't lose a day to it.
You get reporting your team trusts, and a clear answer to what to do next.
What teams say after working with us
Analysis that moved the numbers
FRAI had no clarity on which user segments converted or why others dropped off. We ran deep behavioural analysis and designed the A/B tests, and paid conversion doubled, with a repeatable experimentation process left behind.
Read the case studyNew users were leaving before they saw the product's value. Session-level analysis showed the free plan was locking them out too early. We loosened the limits, activation went up 22%, and time in the app rose by 2 minutes.
Read the case studyCRED's payment routing was leaking money on both success rate and cost. We built a linear-programming routing engine plus a real-time outage-detection model, taking success rate up 7%, cost down 12%, and provider outages down 93% month over month.
Read the case studyThese are real results from teams like yours.
Book a callReporting and analysis questions
How soon do we get insights?
Most teams get their first actionable insight within 2 to 3 weeks. The dashboards come first, then the analysis of where users drop off and why.
How much does reporting and analysis cost?
Reporting and analysis can be a one-time project or a monthly retainer. A retainer suits teams that want dashboards, experiments and ad-hoc questions handled every week.
What do you need from us?
Access to your analytics tool and a short call with each team that will use the dashboards. If your tracking is not reliable yet, we start with an analytics audit, because analysis on broken data gives wrong answers.
Which tools do you report in?
Mixpanel, Amplitude and PostHog for product analytics, and Looker Studio or Metabase when the data lives in a warehouse like BigQuery or Snowflake. We build reports in the tools your team already opens.
Do you run the experiments too?
We design each experiment, set up how it is measured and read the result with you. Your team or ours ships the change, depending on who has access to the code.