The Mindset for Solving Complex Problem Statements
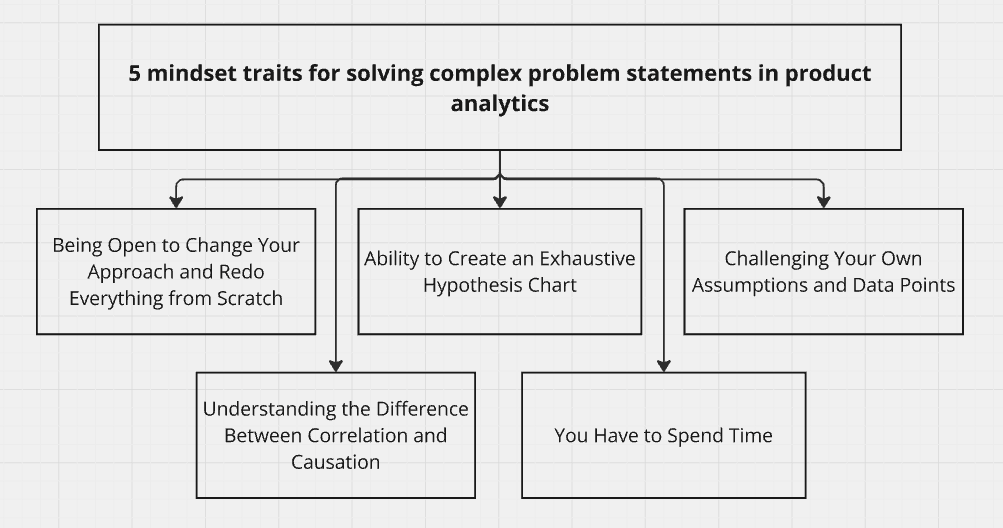
The short version: Five habits: be willing to throw out your approach and start again, know the difference between correlation and causation, build an exhaustive hypothesis chart before narrowing, challenge your own assumptions and your data points, and accept that it takes real time.
Sitting with a problem statement for your product and getting no answers? We've all been there.
It's frustrating because the data is not telling you anything. And, I’ve encountered this issue every time I’m working on a complex problem.
And to be honest with you, it’s when you’re super frustrated - the real game begins.
That’s the time you need to get your brain running, think of a different approach, and go deeper. But, most analysts, PMs, and Founders I’ve encountered stop here - by reporting that there’s not much we got out of data.
And eventually, the company just starts losing trust in data.
The end goal of solving any problem statement should always be very clear → getting some actionable insight. An insight that’s in your control (fully/ partially), & can be used to improve the product.
Until you get to that, you’ve not solved the problem.
Before we get to the mindset part of things, let’s talk about how a complex problem statement feels.
To define complex problems - I believe the easiest way to separate complex problems from others is the fact that complex problems aren’t linear.
What I mean by that is, if for any problem statement, you know that there can only be 10 things to affect the metric, it’s easy to get answers. But, when you encounter a problem where you know that 10 things can affect it, but there can be 100s of other things indirectly affecting it too, it becomes complex.
Any problem that can have indirect effects is usually a complex one to solve. For example, you could have a different feature impacting your metric, and that might not be your first thing to think about.
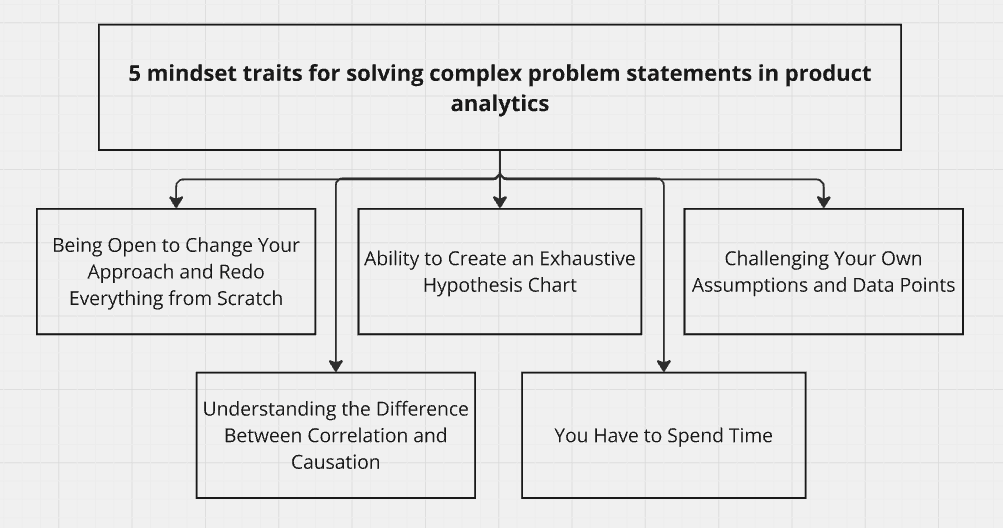
From my experience of having solved quite a few complex problems, I believe you need to have the following 5 mindsets to be capable of solving such problems.
Are you willing to start over?
When data doesn't tell you what you want to hear, it's time to rethink your strategy. It's common to get attached to your initial approach, but sometimes the data isn't wrong; your methods are. In such cases, you need to be open to starting from scratch to gain a fresh perspective and new insights.
Example: Imagine you're analyzing why user engagement on a new feature is low. Your initial analysis might focus on in-app behavior, but after weeks of frustration, you decide to start over. This time, you consider external factors, like marketing campaigns or competitor actions. You discover that a competitor's promotion significantly impacted user attention, a factor you missed initially.
Do you know correlation from causation?
Data can be deceptive, and in most cases, it is. Just because two metrics are highly correlated doesn't mean one causes the other. You need to be able to logically distinguish between correlation and causation to avoid false conclusions.
Example: Suppose there's a sudden spike in app downloads and a simultaneous increase in customer complaints. It might seem like the new users are unhappy. However, further analysis reveals that a recent app update caused glitches, which both new and existing users experienced. The spike in downloads was due to a successful marketing campaign, while the complaints were due to the update.
Can you build an exhaustive hypothesis chart?
Understanding and being able to list all possible factors that could impact the metric you're analyzing is crucial. This could include user actions within the product, their demographics, and sometimes even their actions off the product. Remember, your product is just a small part of the user's world.
Example: When trying to improve the retention rate of an e-commerce app, you list potential factors: product range, pricing, app performance, user interface, and even external factors like seasonality or economic trends. By examining these hypotheses, you realize that users tend to drop off during economic downturns, prompting a strategy shift to offer more budget-friendly options.
Are you challenging your assumptions and your data?
Getting too confident with your initial findings can lead to a dead end. Always question your assumptions and the data you're looking at to keep diving deeper. Do this till you encounter a point where there are no more questions to ask. That’s the point when you’ve probably uncovered the truth.
Example: You assume that users prefer a minimalist app design based on initial feedback. However, deeper analysis shows that while a subset of users prefers minimalism, the majority find it too sparse.
Are you giving it enough time?
Good analysis takes time. Rushing for quick insights often leads to superficial results or nothing at all. You need to spend time to get actionable insights. I’ve often seen problem statements abandoned at a crucial time, where with a little more time you would’ve gotten some great actionable insights.
Example: While working on improving user onboarding, you take a day to deliver insights. You quickly analyze the most obvious metrics and recommend a few minor changes. However, you probably miss out on deeper issues like understanding the user's initial confusion, lack of personalization, etc. If you spent more time, you could have revealed more critical and comprehensive insights.
Conclusion
Solving complex problem statements requires you to have a strategic mindset and a willingness to adapt and challenge yourself.
You can uncover actionable insights that drive real improvements by being open to redoing your work, understanding the nuances of data, creating comprehensive hypotheses, questioning your assumptions, and investing time in thorough analysis.
Remember, the journey might be frustrating, but it's in these moments of struggle that true innovation happens.
Hope this was helpful. If you’re looking for any help with Mixpanel or product analytics, feel free to reach out using any of the below methods.
LinkedIn | Email - anshdoesanalytics@gmail.com | Book a slot on my calendar
Frequently asked questions
Why does correlation vs causation matter so much in analytics?
Because almost every finding you'll surface is correlational, and acting on it as if it were causal is how teams ship changes that move nothing. Knowing which one you have decides whether you need an experiment.
What is an exhaustive hypothesis chart?
Every plausible explanation written down before you start narrowing. Skipping it means you test the first hypothesis you thought of, which is rarely the right one.
Why should you challenge your own data points?
Because a broken event doesn't announce itself. If a number surprises you, the first hypothesis should be that the number is wrong.
Get new posts by email
Simplifying analytics for Founders and PMs. One email when a post goes out.