Mixpanel setup → The right way
Here's the best way to setup Mixpanel to gain insights about user behavior.
The short version: Five steps, in order: write the event tracking spec, insert the code and verify data actually flows, build an analytics strategy on top, put up the dashboards, then do the deeper analysis. Most failed setups skip straight to step 4.
An end-to-end Mixpanel setup has 5 steps:
Related: how to set up product analytics the right way, for any tool.
- Creating the Event Tracking implementation Spec
- Inserting code into the product codebase & ensuring accurate data flow into Mixpanel
- Create an analytics strategy
- Building out dashboards on Mixpanel
- Deep dive to gain insights
Let’s go through each step in detail.
Step 1: What goes in the event tracking spec?
An Event tracking plan is a structured document that lists down all the user interactions that need to be tracked, along with the data to be sent with each interaction.
User interactions are called events, & data sent with them are called properties.
Here’s a sample tracking plan for your reference. Feel free to duplicate it, & use it for your product. Refer here for a detailed guide on creating the tracking plan.
💡 Note: Please ensure to use User profile properties & Super properties in your tracking. They will allow you to do deeper analysis.
To read more about what are super properties, & user profile properties, read this article.
Step 2: How do you insert the code and verify the data?
Once the tracking plan is ready, ask your Developer to follow the tracking plan & insert code accordingly. Refer to Mixpanel documentation for more details on how to send the code.
Next, fire events from your product, go to Mixpanel, & ensure all events & properties are flowing in the right manner.
If they’re not, talk to the developer & get them fixed.
Step 3: How do you build the analytics strategy?
The objective of the analytics strategy is to be able to build a story around your product, about how users are using the product.
There are multiple frameworks that you can use to create an analytics strategy. The one, I love the most is using the AAARRR funnel.
Here’s a quick article on how you can use AAARRR funnel to create the analytics strategy.
💡 Make sure you have a north star metric for each piece of the AAARRR funnel, & then KPIs that can inform the north star metric.
Step 4: How do you build the dashboards?
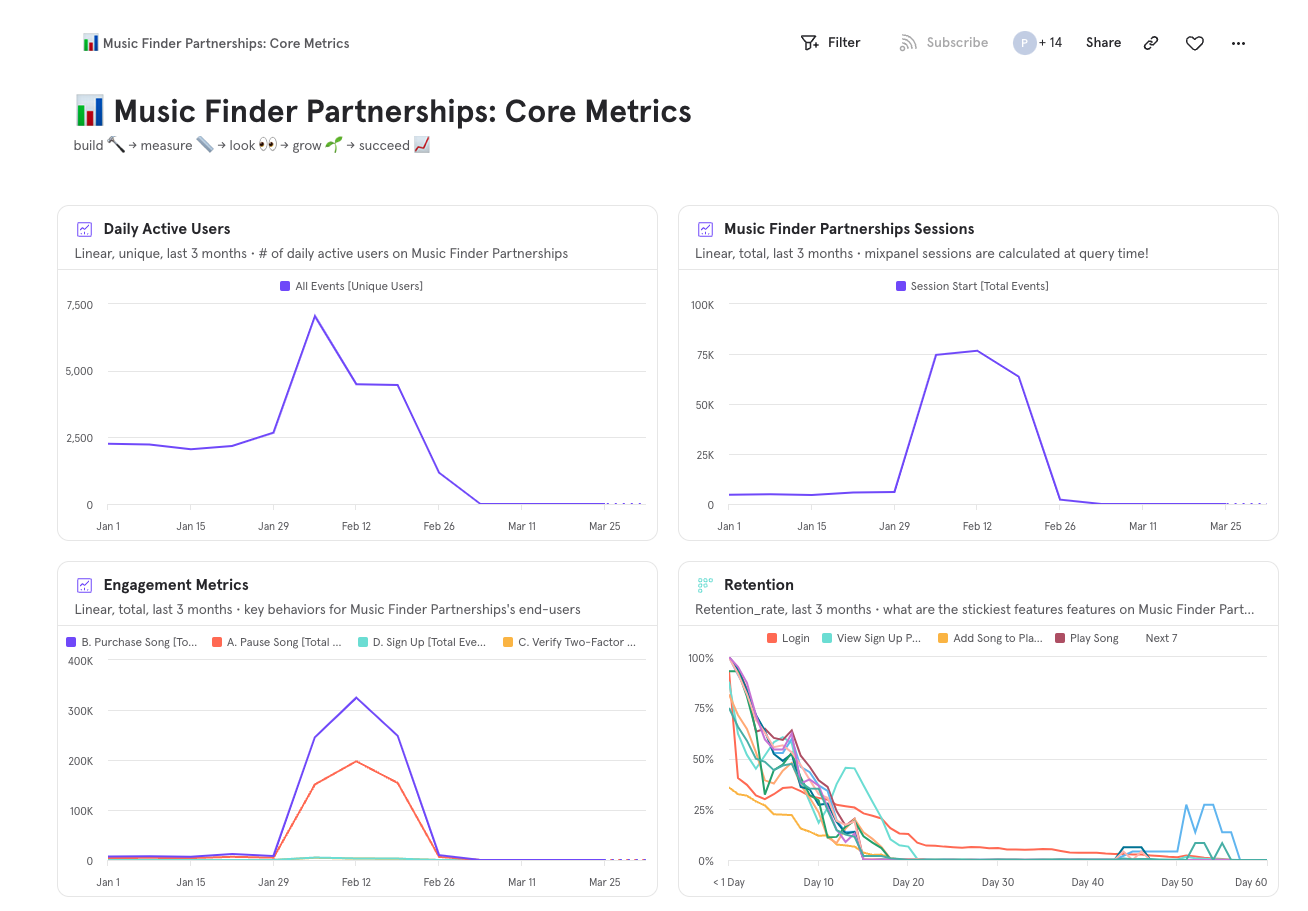
A dashboard should tell a story, & should be on point. Hence, it’s very important to structure them in the right way.
Follow the analytics strategy, & build out those metrics on Mixpanel.
While building dashboards, ensure the following:
- The dashboard must tell the entire story about the product. For example, if you have a dashboard around Awareness, the dashboard should answer questions like where’s the traffic coming from, what’s the bounce rate, etc.
- The dashboards should be pretty easy to read, & understand.
- The dashboards should be dynamic. This means easy filtering using properties, user cohorts, etc.
Step 5: What does deeper analysis look like?
The initial setup of dashboards will give you a good overall understanding of what’s happening in your product.
However, it will not help you answer the “Why”, or improve the product.
You can only do this by:
- Developing hypothesis from the dashboards/ Identifying weak areas
- Running A/B tests/ Deep dive to understand the “WHY” behind
- Introducing changes to the product
- Measuring impact on the North star
💡 Use analytics as an insight tool, not as an information tool.
If you’re only using Mixpanel to get metrics, you’re doing it wrong. You’re not utilizing it to its fullest. Use it to understand user behavior, run experiments, & drive the product forward.
Hope this was helpful. If you’re looking for any help on the mixpanel setup, feel free to reach out using any of the below methods.
LinkedIn | Email - anshdoesanalytics@gmail.com | Book a slot on my calendar
Frequently asked questions
What are the five steps of a Mixpanel setup?
Event tracking spec, implementation with verified data flow, analytics strategy, dashboards, then deeper analysis. The order matters — each step depends on the one before it.
Why can't you start with dashboards?
Because a dashboard built on unverified events shows you numbers that look right and aren't. The spec and the verification are what make everything above them trustworthy.
What's the most skipped step?
Verification. Inserting the code is treated as the finish line, when the actual finish line is firing every event from every surface and confirming it lands with the right properties.
Get new posts by email
Simplifying analytics for Founders and PMs. One email when a post goes out.