Analytics strategy: choosing metrics that are actionable
A metric belongs in your analytics strategy only when it can change a decision. On its own, a metric usually tells you nothing. Set it next to two or three others, like sign-ups by channel or by country, and write down for each one what it counts and the question it helps you answer.
When you start thinking about what to measure, the worst thing you can do is open an AI tool, ask it what metrics to track for your product, and plot whatever comes back.
It has context. It will give you a list. The list will look reasonable.
But if those metrics are wrong, you are looking at garbage data, and garbage data gives you garbage information. You will sit in front of a dashboard, think everything looks good, and carry on.
So the metrics have to actually make sense. They have to be actionable. They have to help you make a decision.
When does a metric become actionable?
Often a metric on its own tells you nothing. The same metric next to two or three others tells you everything.
Take a chart of signups over time. Signups went up. Signups went down. Fine. There is nothing you can do with that. It is a Vanity metricA number that feels good when it goes up but does not tell you why it moved or what to do next.Glossary: a number that makes you feel good or bad but does not tell you what to do.
Now put a chart next to it that shows signups by channel, or by country. Now you can see that you suddenly started getting signups from a channel that was quiet last month. That you can act on.
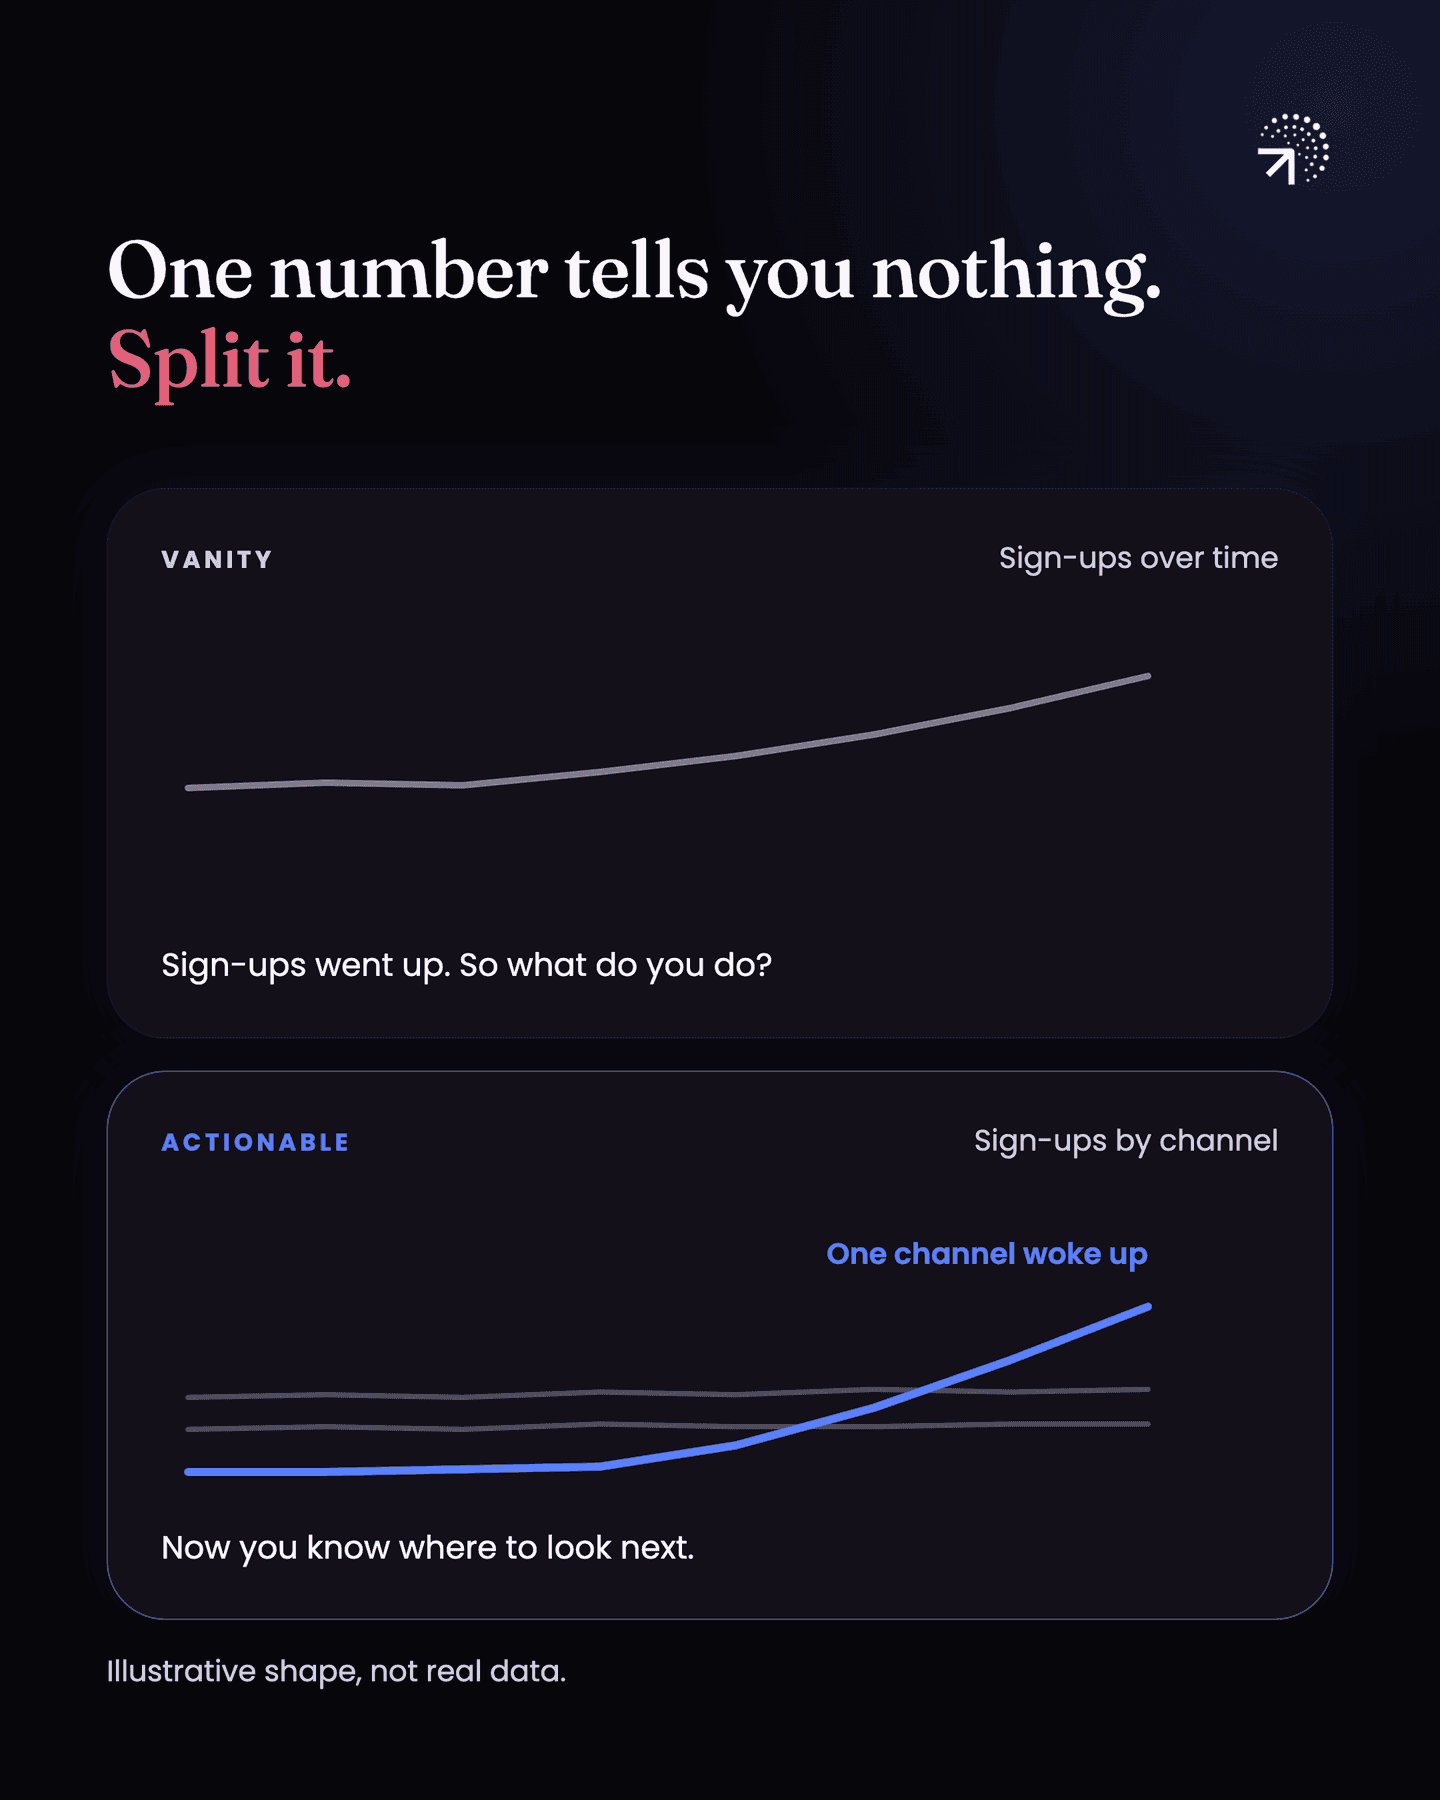
Your analytics strategy needs those sets, not just the headline number.
What framework should you build an analytics strategy on?
I will keep this simple.
Follow the AAARRR funnel. It is also called the pirate funnel, and it stands for Awareness, Acquisition, Activation, Retention, Revenue, Referral. The pirate name comes from Dave McClure's Startup Metrics for Pirates deck, which lists five of these stages: acquisition, activation, retention, referral and revenue.
We already spoke about how every product is a funnel. What this framework does is break your product into six parts, so you can look at each one on its own instead of staring at the whole product at once.
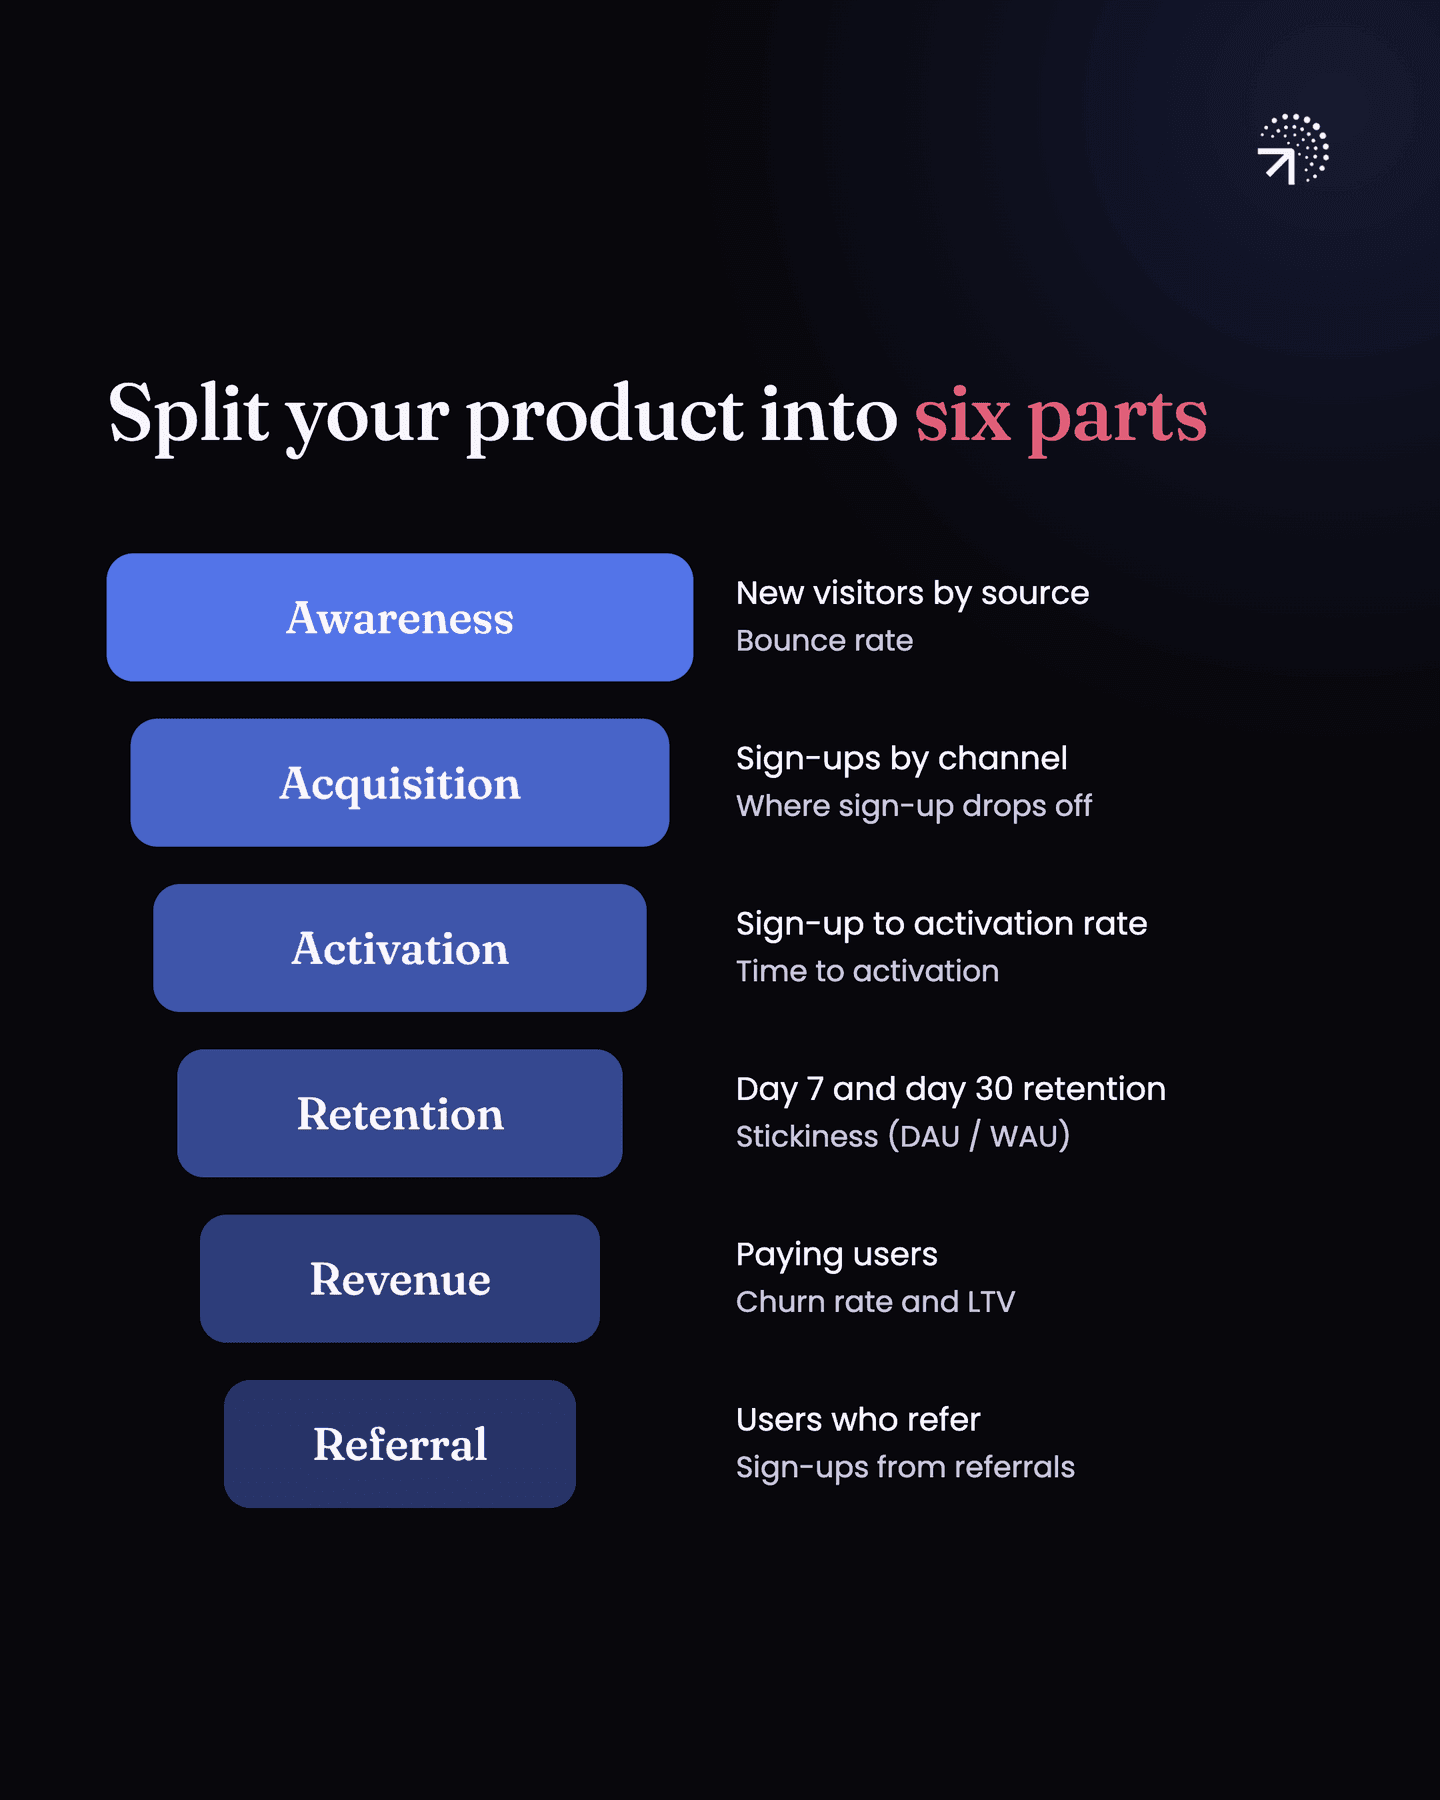
- Awareness is how many people are coming to your website, what pages they visit, and where they came from.
- Acquisition is signup. How many people sign up, how many drop off partway, which channels bring in the most signups, what the conversion rate looks like by channel and by country. If you have an onboarding flow, that sits inside acquisition too.
- Activation is the moment a new user first gets real value from your product, the "aha" we talked about in the funnel chapter. Here you track how many people activate, what feature they activate on, and how long it takes them.
- Retention is whether people come back to the platform and how often. Engagement lives here as well: which features are being used, and how often.
- Revenue is how much money you are making and who is paying you. Which channels those users came from, what you know about them from onboarding, and what persona they fit (the type of customer, like "agency owner" or "solo marketer").
- Referral is who is referring other people, how many people they refer, and whether those referred users actually join.
Once the product is split up like that, coming up with metrics for each part gets much easier.
What should you write down for every metric?
This is where AI can help, by all means. Use it to get a first list. The problem at the start of this chapter is plotting that list without checking it. So be careful with every metric it hands you.
For each metric, write down two things:
- The definition. What exactly is being counted.
- The question it helps you answer. Why does this metric matter to you?
Here is what that looks like for the example from earlier:
| Metric | Definition | Question it helps you answer | Keep it? |
|---|---|---|---|
| Signups by channel | Number of completed signups each week, split by the channel the user came from. | Which channels are bringing in signups, and is any channel suddenly growing or dropping? | Yes |
| Signups over time | Number of completed signups each week. | None. It goes up or down and there is nothing you can do with that. | No, it is a vanity metric |
If you cannot write the question, the metric is probably a vanity metric and you can drop it. If you can write it for every metric, you end up with a dashboard where every chart has a reason to be there.

Which metrics should you track at each funnel stage?
No matter what you are running, and this holds for most businesses, particularly SaaS, Fintech, D2C and consumer apps, your funnel should look something like this.
Awareness
- New users, meaning new visitors to your website
- New users by country
- New users by source
- New users by channel
- Bounce rate, roughly how many users came to the website and dropped off within 15 seconds
- Landing pages, so you know what the first page people see actually is
- New users by city
- New users by device, mobile against desktop
Acquisition
- Overall signups
- Signups by method, so you know how people are choosing to sign up
- The signup funnel, start to finish
- How many people started signup and did not finish
- Which step they dropped off on
- New user to signup funnel by source
- New user to signup funnel by country
- New user to signup funnel by channel
- New user to signup funnel by web against mobile
Activation
- Signed up users who go on to activate
- Which feature they activate on
- Signup to activation funnel by the source they signed up from
- Signup to activation funnel by channel
- Signup to activation funnel by country
- Signup to activation funnel by mobile against web
- Time to activation, how long it takes from signup to that first moment of value
- Whatever else is specific to the features you have
Retention
- Daily active users
- Stickiness ratio, daily active over weekly active, or weekly active over monthly active, depending on how often your product is meant to be used. It tells you how many of your active users come back regularly instead of once in a while.
- Day 7 retention (the share of new users still coming back 7 days after signup), tracked over time
- Day 30 retention (the same, 30 days after signup), tracked over time
- Which features your users are actually using
- Which features nobody is touching at all
- How many times a single user uses each feature
- Each feature broken down by whatever is relevant to it
On that last one, say you run a social media platform and someone creates a post. There are different kinds of posts, so you would want to know what people are actually creating. Text posts? Photo posts? Video posts?
Revenue
- Users paying
- New users subscribing
- Users renewing
- Churn rate
- Revenue
- LTV, lifetime value, the total revenue you expect from one customer
- Signup to revenue by the channel the user came from
- Signup to revenue by country
- Signup to revenue by whatever else matters to you
Referral
- How many users are referring
- How many users signed up through a referral
- What kind of user refers you
- Whether your referrers come from a particular channel
Common questions
What makes a metric actionable?
It changes a decision. Sign-ups over time tells you nothing on its own. Sign-ups by channel tells you which channel woke up, and that points at something you can do.
How do you build an analytics strategy?
Start from what the business is trying to do, pick the metrics that would change a decision, and write down for each one its definition, its calculation and the action you'd take if it moved.
What is the AAARRR funnel?
The AAARRR funnel, also called the pirate funnel, splits your product into six parts: Awareness, Acquisition, Activation, Retention, Revenue and Referral. Looking at each part on its own makes it much easier to come up with metrics for it.
Should you use AI to choose your metrics?
Use it to get a first list, but check every metric it hands you. Plot its list without checking and you can end up with a dashboard that looks fine and says nothing.