The art of reading data: definition plus context
Reading data well means defining a metric so a movement points at something concrete, then reading it with the business context to know what it means.
A founder sees a number move, and sends their data person a message: I saw this drop, can you check why?
Often the answer was already on the dashboard they were looking at. What was missing was a metric defined well enough to point at something, and the business context to make sense of it moving.
So there are two parts to this. The first is how you define the metric. The second is how you read it once it is in front of you.
Let's start with the first.
How do you define a metric so it is actually useful?
Any metric can be calculated in more than one way. Signup rate, ActivationThe point where a new user reaches the first moment of real value in your product, rather than merely creating an account. Every product defines its own activation event, and that definition decides what your activation rate means.Glossary, churn, LTV. Same name, different definitions, different numbers, and often different conclusions. Stripe's Billing analytics documentation is one example: it lets you configure how churn is calculated, and its subscriber churn rate divides churned subscribers by the active subscribers 30 days ago plus the new ones added since.
So the first part of reading data well is being very clear about which definition is the most actionable and the most accurate for your product. The test I use: when the number moves, can I tell exactly what moved, and which users I should go and look at?
Take churn, because you can plot churn in any number of ways.
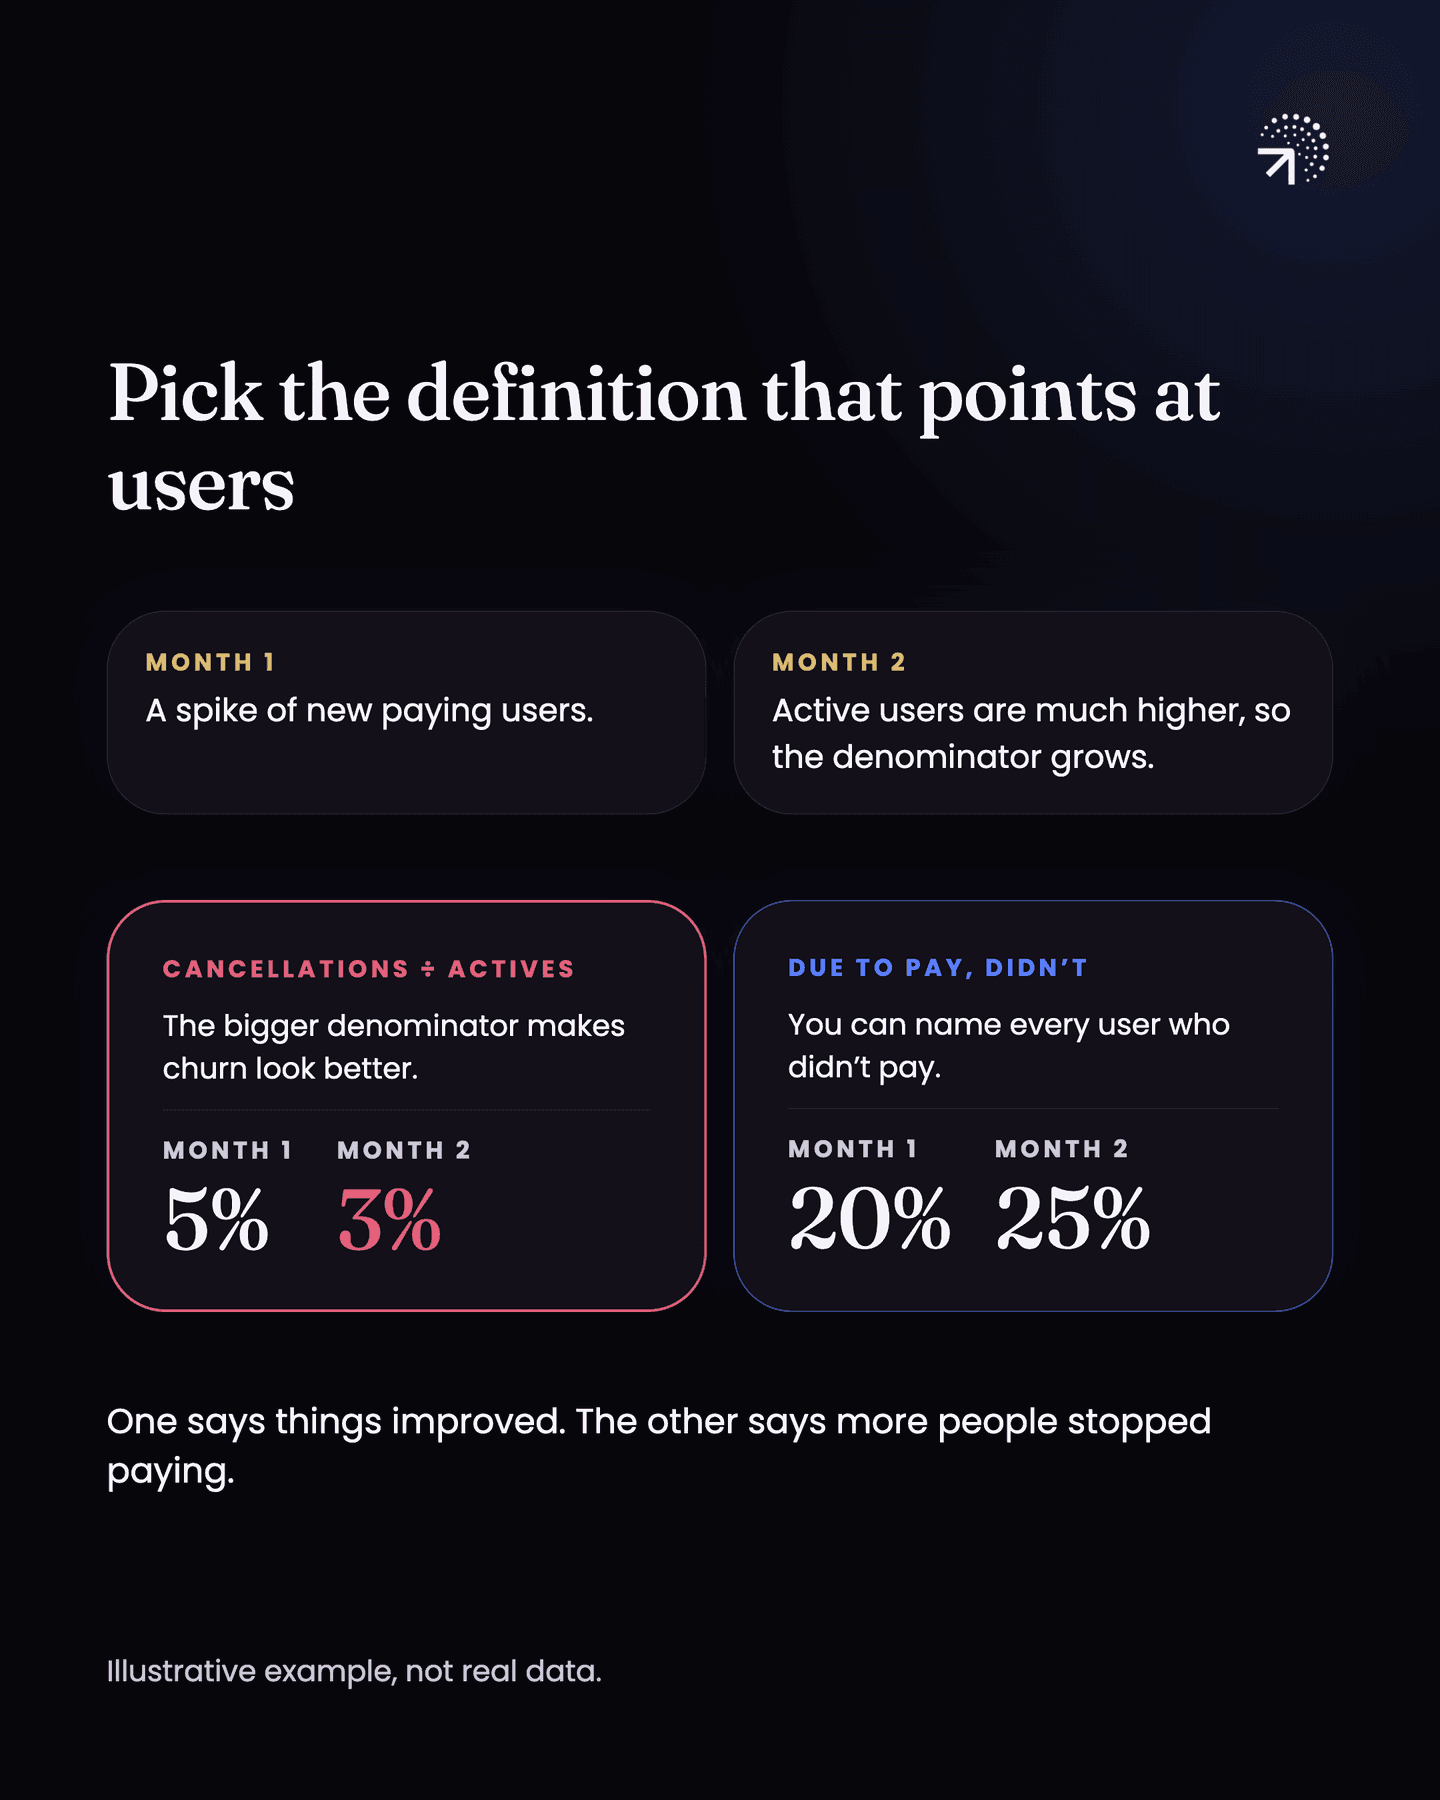
Most people plot it as: how many users cancelled this month, divided by how many total active users we had this month.
You can measure that. It just will not get you anywhere, because when the number moves you cannot tell which half of it moved, and you cannot name a single user to go and look at.
My definition of churn is: how many users were due to pay an invoice this month and did not pay.
If that number is 20%, you know exactly what it means. Out of a hundred users who were supposed to pay, twenty did not. You can go into those twenty users and find out why. When the number moves, you know what moved.
Now look at the other version: cancellations divided by total active users.
Say last month you had a spike in new paying users. This month your active user count is much higher, so your churn rate looks much lower. Your actual churn did not improve. The number you divide by, total active users, just got bigger.
The churn rate looks good, so you never go and fix anything. Meanwhile the count of users who were due to pay and did not pay may have gone up.
| Churn definition | What 20 lost users look like | When the number moves |
|---|---|---|
| Cancellations divided by total active users | 5% of four hundred active users | You cannot tell which half moved, and a spike in new paying users makes churn look lower |
| Users who were due to pay this month and did not pay | 20% of the hundred due to pay | You know exactly what moved, and you can go into those twenty users to find out why |
So the first part of the art is building metrics with definitions that fit your business and your context, and that point at something you can act on. Most people get this wrong.
How do you read a metric instead of just looking at it?
Looking at a metric and reading it are different things.
Reading it means bringing what you already know about the business to the number. A launch last week, a pricing change, a holiday. Then you pull up three or four related metrics and put together a story: this is what is happening, and this is what I need to do about it.
Most founders stop before that. They look at one metric and decide it is good or bad.
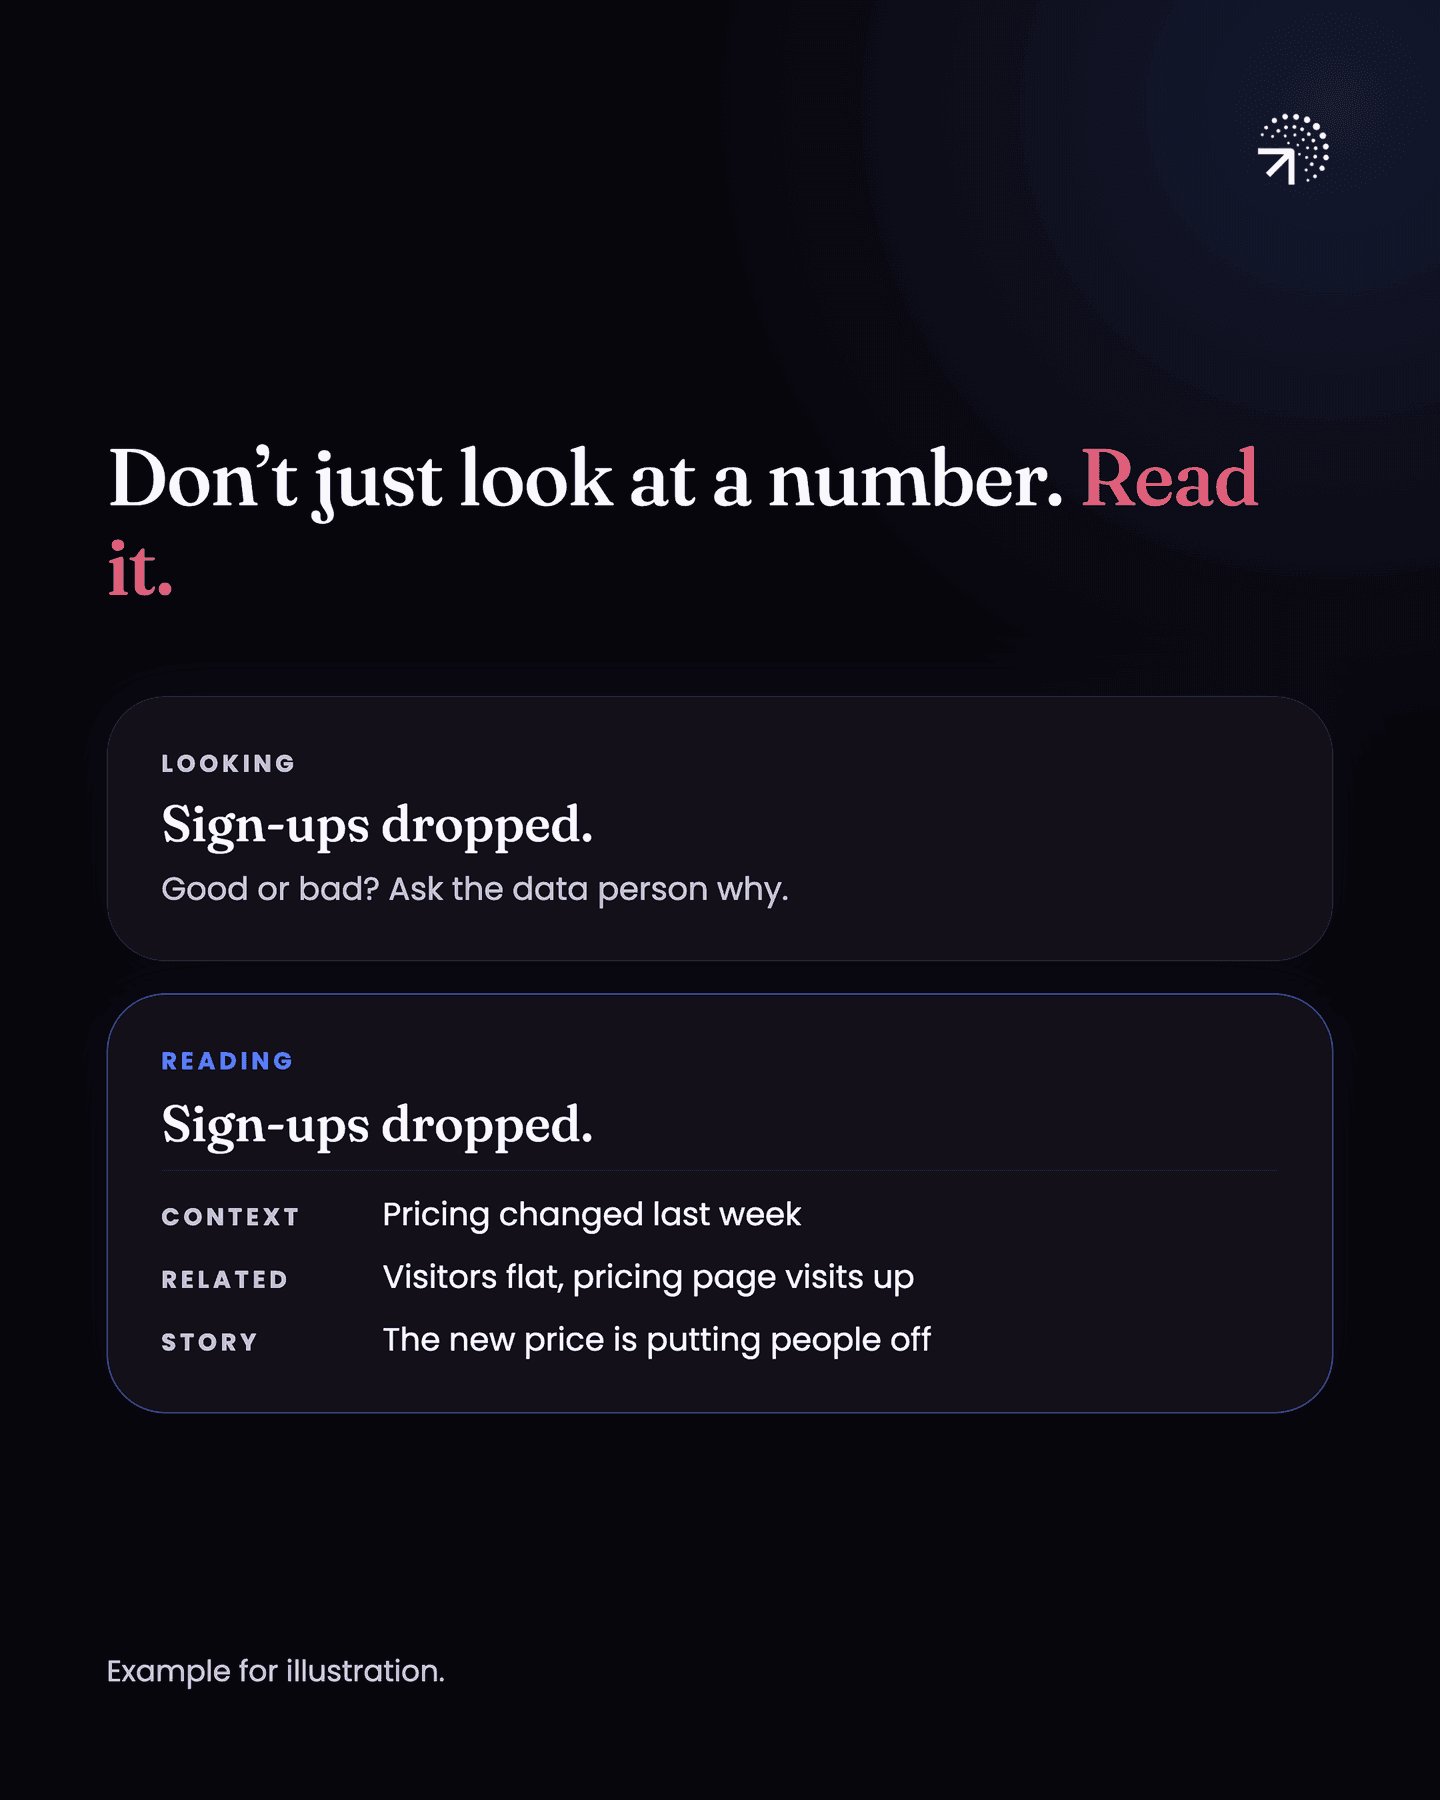
This is why most founders, product managers, and growth folks end up going back to their data person with "I saw this drop, can you check why?" All they needed was some business context, a look at a few other metrics, and a story that held together.
So there are two abilities to build.
- The first is plotting the right metrics, with definitions you can actually act on.
- The second is reading them. Not just seeing the number, but understanding what is going on around it and forming a story.
If you do that, you can often answer the question yourself. When you cannot, you walk up to your analyst with a real question instead of "can you check why?":
- Here is what I am seeing.
- Here is why I think it is happening.
- Here is the supporting data.
- Can you go deeper and confirm it?
Common questions
How do you read a metric properly?
Define it tightly enough that a movement points at a specific thing, then read it against what you already know about the business: what launched, what changed, what season it is. Without the second half you can only describe the chart.
Why can't my data person explain why a number dropped?
Usually the metric isn't defined well enough to point at anything, or they don't have the business context to interpret it. Both are fixable.
What is the best way to define churn?
Count the users who were due to pay an invoice this month and did not pay. If 20 out of 100 did not pay, churn is 20%, and you can go into those twenty users and find out why.
Why does my churn rate look lower after a month of strong growth?
If you divide cancellations by total active users, a spike in new paying users makes the number you divide by bigger. The churn rate looks lower even though your actual churn did not improve.
What should you bring to your analyst when a number drops?
What you are seeing, why you think it is happening, and the supporting data, and then ask them to go deeper and confirm it. That is a real question instead of "can you check why?"