Rate and mix analysis: why your conversion rate moved
When a conversion rate moves, two different things can move it: the rates inside each segment, and how much volume each segment got. Build one counterfactual period and the two separate cleanly.
Let’s start with an example. Your payment success rate dropped this week. You start breaking it down by SegmentA group of users who share something: a country, an acquisition channel, a signup method, a first-session length. Splitting a metric by segment is what makes it actionable.Glossary, and the interesting one turns out to be payment provider: Razorpay, Stripe, PayU.
Two things changed at once.
- Last week half your transactions went through Razorpay. This week it is under a third.
- The individual success rates changed too, and not all in the same direction. Stripe actually got better this week, and your overall number still fell.
This is where most root cause analysis (working out what actually caused a number to move) stalls. You can see that both things moved. You cannot say which one did the damage.
What your team needs is a sentence like this: "the success rate fell 3.6 points, and 3 of those points are Razorpay's success rate." A point here is a percentage point: 80% to 76.4% is a drop of 3.6 points. Rate and mix analysis is how you get to it.
What table do you need for rate and mix analysis?
Put both weeks side by side, broken out by provider. For each provider you want transactions initiated, transactions completed, and the success rate. Then the overall row.
Last week
| Provider | Initiated | Share | Completed | Success rate |
|---|---|---|---|---|
| Razorpay | 50,000 | 50% | 42,000 | 84% |
| Stripe | 30,000 | 30% | 24,000 | 80% |
| PayU | 20,000 | 20% | 14,000 | 70% |
| Overall | 100,000 | 100% | 80,000 | 80.0% |
This week
| Provider | Initiated | Share | Completed | Success rate |
|---|---|---|---|---|
| Razorpay | 30,000 | 30% | 23,400 | 78% |
| Stripe | 30,000 | 30% | 24,600 | 82% |
| PayU | 40,000 | 40% | 28,400 | 71% |
| Overall | 100,000 | 100% | 76,400 | 76.4% |
Every number in the rest of this chapter comes out of those two tables.
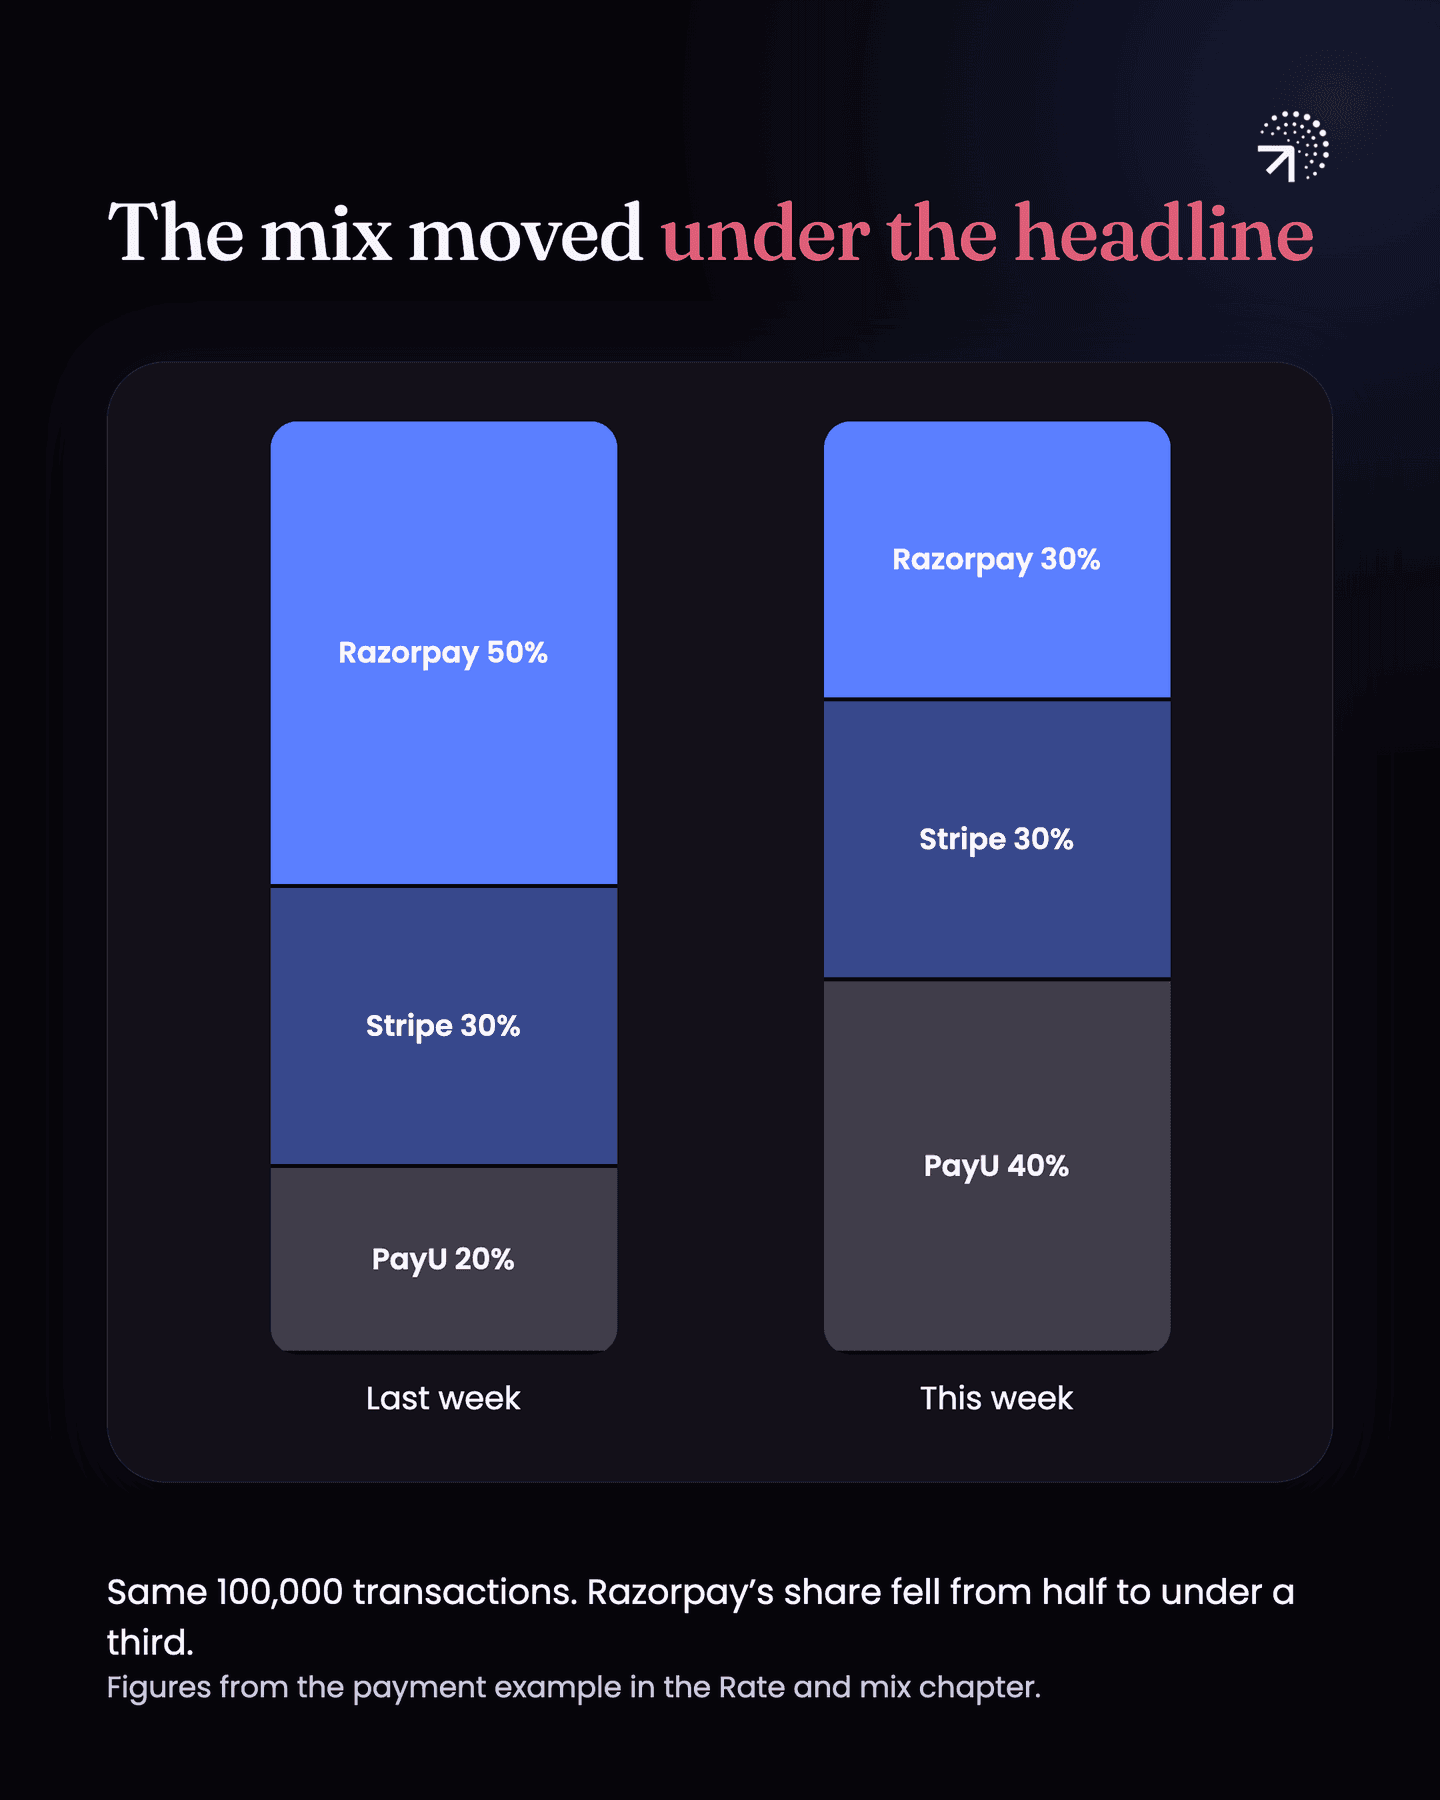
Look at what they say. Razorpay fell six points, from 84% to 78%. Stripe went up two. PayU went up one. And the overall rate dropped 3.6 points, from 80% to 76.4%.
Two of your three providers improved and your headline number got worse.
How do you measure the rate effect?
Hold the mix still and let only the rates move. You want to know how much of the 3.6 point drop came from the distribution shifting, and how much came from the providers themselves performing differently.
Build one made-up week to find out. It is a "what if" week, usually called a CounterfactualA made-up period built to answer a what-if: what this week would have looked like if only one thing had changed. It is the device that separates a rate effect from a mix effect.Glossary: what this week would have looked like if nothing had moved except the success rates. Statisticians call this direct standardization, and it is old: Keiding and Clayton's history of the method traces it to 1844 and defines it as calculating what a rate would have been if the population's make-up had matched a standard one.
So keep this week's success rates exactly as they are. Put last week's mix back.
Last week the split was 50%, 30%, 20%. Apply that split to this week's total of 100,000 transactions, then run this week's success rates against it.
| Provider | Initiated (last week's mix) | Success rate (this week) | Completed |
|---|---|---|---|
| Razorpay | 50,000 | 78% | 39,000 |
| Stripe | 30,000 | 82% | 24,600 |
| PayU | 20,000 | 71% | 14,200 |
| Overall | 100,000 | 77,800 |
That counterfactual week lands at 77.8%.
Now you have three numbers, and the gaps between them are the whole answer.
Last week, actual          80.0%
Counterfactual week        77.8%
This week, actual          76.4%
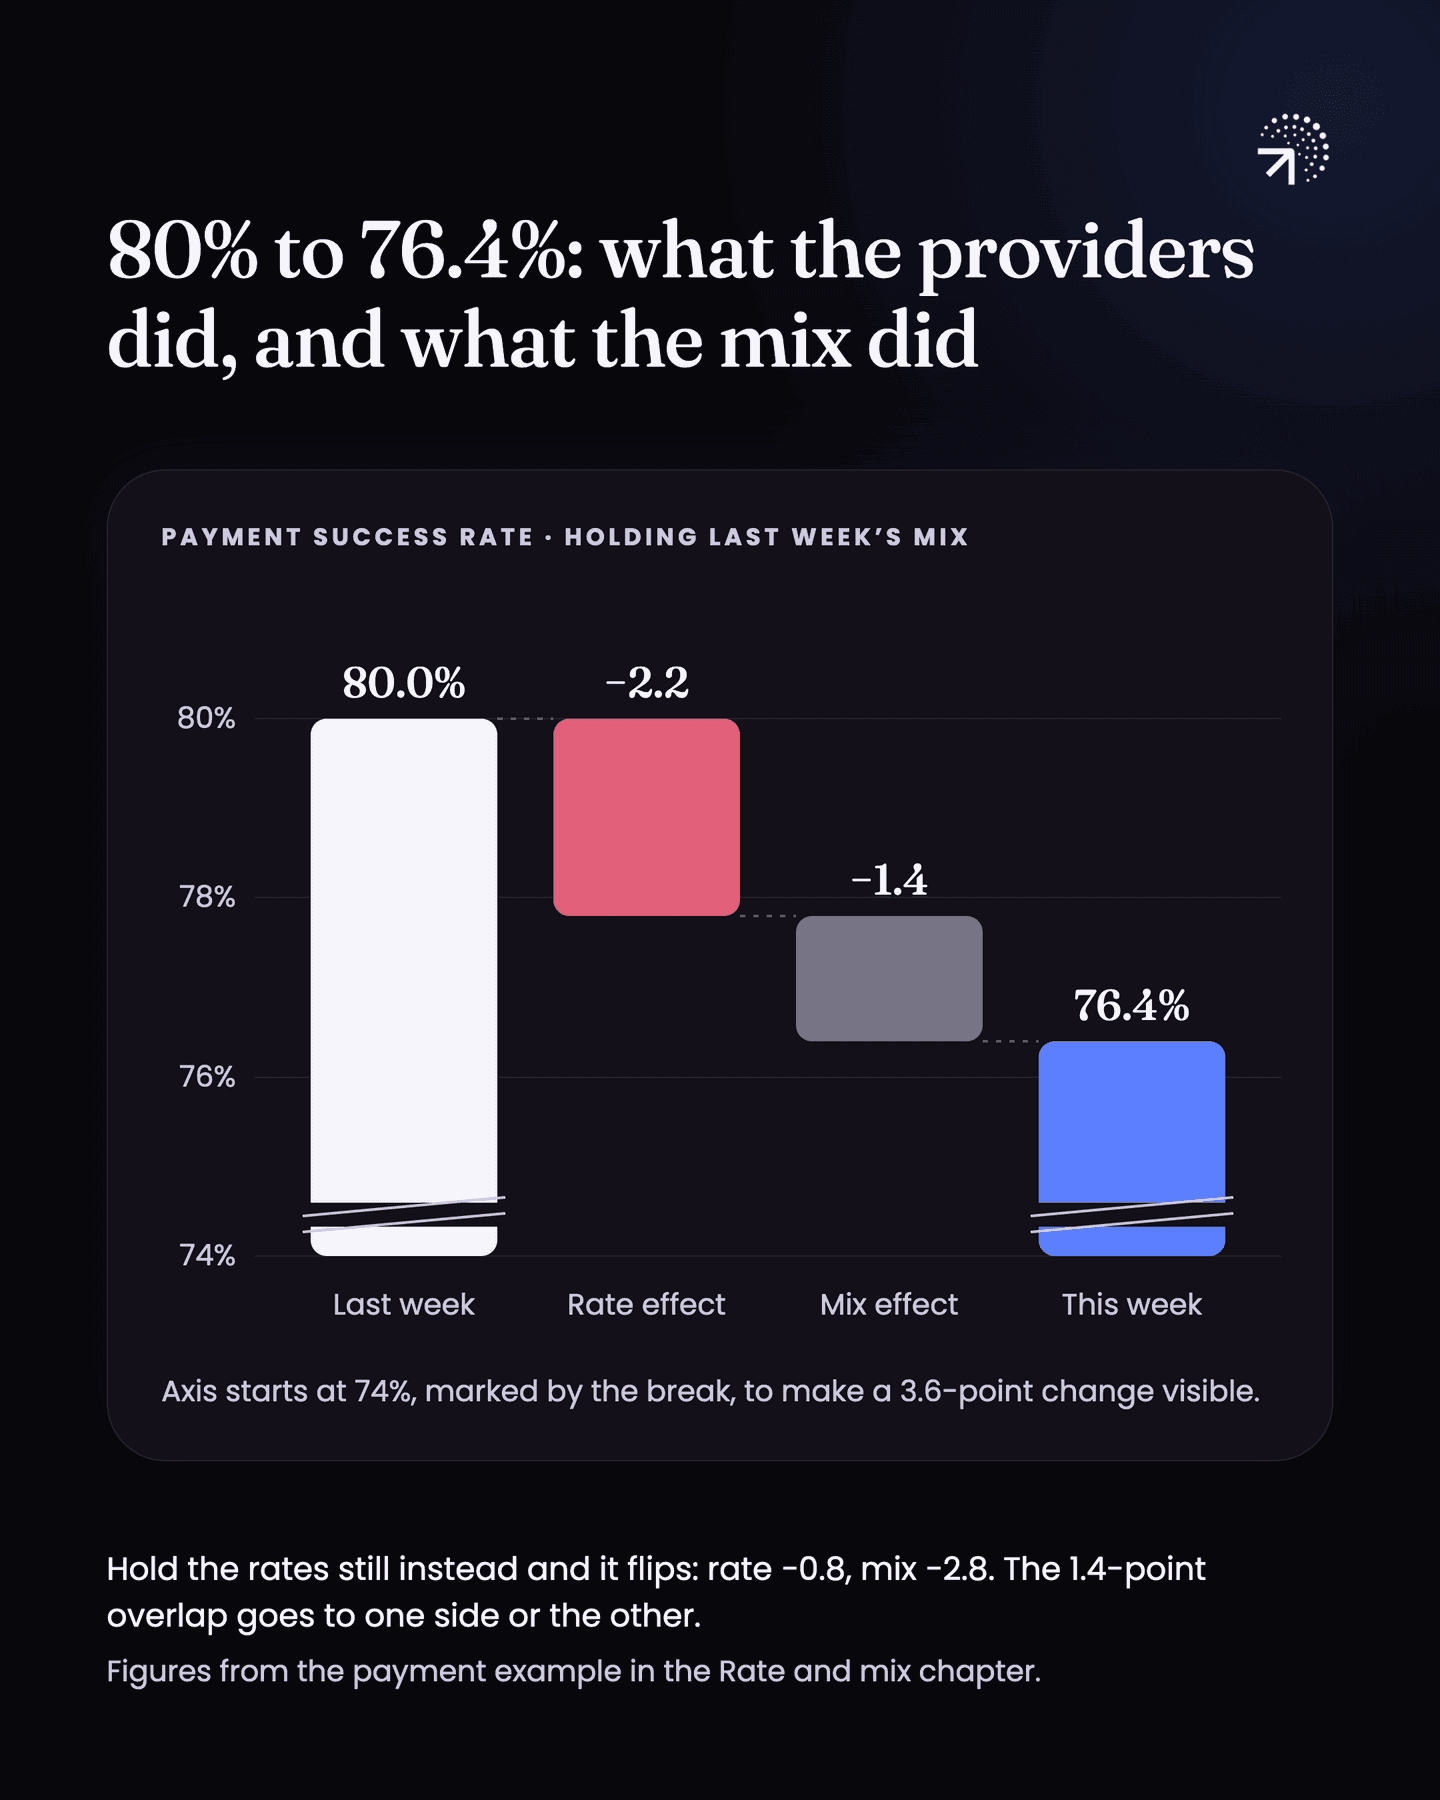
The gap from 80.0 to 77.8 is the Rate effectThe part of a change in a rate caused by segments performing differently, with the mix between them held still.Glossary. It is what the providers did, with the mix held still. That is -2.2 points.
How do you measure the mix effect?
Hold the rates still and let only the mix move. You just did it one way. Now do it the other way, because the second version is the one that tells you whether your split is stable.
This time keep last week's success rates exactly as they are. Put this week's mix in.
This week the split was 30%, 30%, 40%. Apply that split to 100,000 transactions, then run last week's success rates against it.
| Provider | Initiated (this week's mix) | Success rate (last week) | Completed |
|---|---|---|---|
| Razorpay | 30,000 | 84% | 25,200 |
| Stripe | 30,000 | 80% | 24,000 |
| PayU | 40,000 | 70% | 28,000 |
| Overall | 100,000 | 77,200 |
This counterfactual lands at 77.2%.
Same three numbers, different middle one.
Last week, actual          80.0%
Counterfactual week        77.2%
This week, actual          76.4%
The gap from 80.0 to 77.2 is the Mix effectThe part of a change in a rate caused by volume moving between segments rather than by any segment performing differently.Glossary now, because the rates never moved in that step. That is -2.8 points.
Why do the two ways of splitting rate and mix disagree?
They disagree because of the overlap: the points where rate and mix moved together get counted on one side or the other. Put the two answers next to each other.
                    Rate effect    Mix effect
Hold the mix still     −2.2          −1.4
Hold the rates still   −0.8          −2.8
Both add up to -3.6. But the rate effect is -2.2 in one and -0.8 in the other, and that is a big enough difference to change who you go and talk to.
The reason is that two things happened to Razorpay at once. Its success rate fell, and its share of volume fell. The points where those overlap belong to both effects and to neither, and the overlap here is worth 1.4 points.
Note: you can see the overlap directly. The rate effect on its own, using last week's mix, is -2.2. The mix effect on its own, using last week's rates, is -2.8. Those sum to -5.0, which is more than your actual drop of -3.6. The extra 1.4 is the overlap, counted twice.
Each counterfactual gives that 1.4 to one side. Holding the mix still gives it to mix. Holding the rates still gives it to rate. Neither is wrong. They are answering slightly different questions.
Common questions
What is rate and mix analysis?
A way of splitting a change in a conversion rate into two causes: how each segment performed, and how much volume each segment received. You build a counterfactual period holding one of them still, and the gap tells you the size of each effect.
Why did my conversion rate fall when most segments improved?
Because the mix shifted. If volume moves towards a segment with a lower rate, the overall number can fall even when two of three segments got better. That's exactly the case rate and mix analysis is built for.
What is the difference between the rate effect and the mix effect?
The rate effect is what the segments themselves did, with the mix held still. The mix effect is what the shift in volume between segments did, with the rates held still.
Why do the rate and mix effects change depending on which one you hold still?
When a segment's rate and its share of volume both move, the points where those overlap belong to both effects and to neither. Holding the mix still gives the overlap to mix, and holding the rates still gives it to rate. Neither is wrong; they answer slightly different questions.