A framework for any product problem: four questions
Low retention, low activation and low signup-to-paid conversion are the same problem from a data perspective. Take apart any of them and it boils down to: who converts, what they did that everyone else did not, what the two say together, and which of them actually caused the conversion.
Say your signup to paid conversion rate sits at 5%, and you want to move it. There are four things you need to work out, in this order.
- Who are the users that convert?
- What did they do that everyone else did not?
- What happens when you put those two together?
- Which of the two actually caused the conversion?
That is the whole framework. All the work is in doing it in that order.
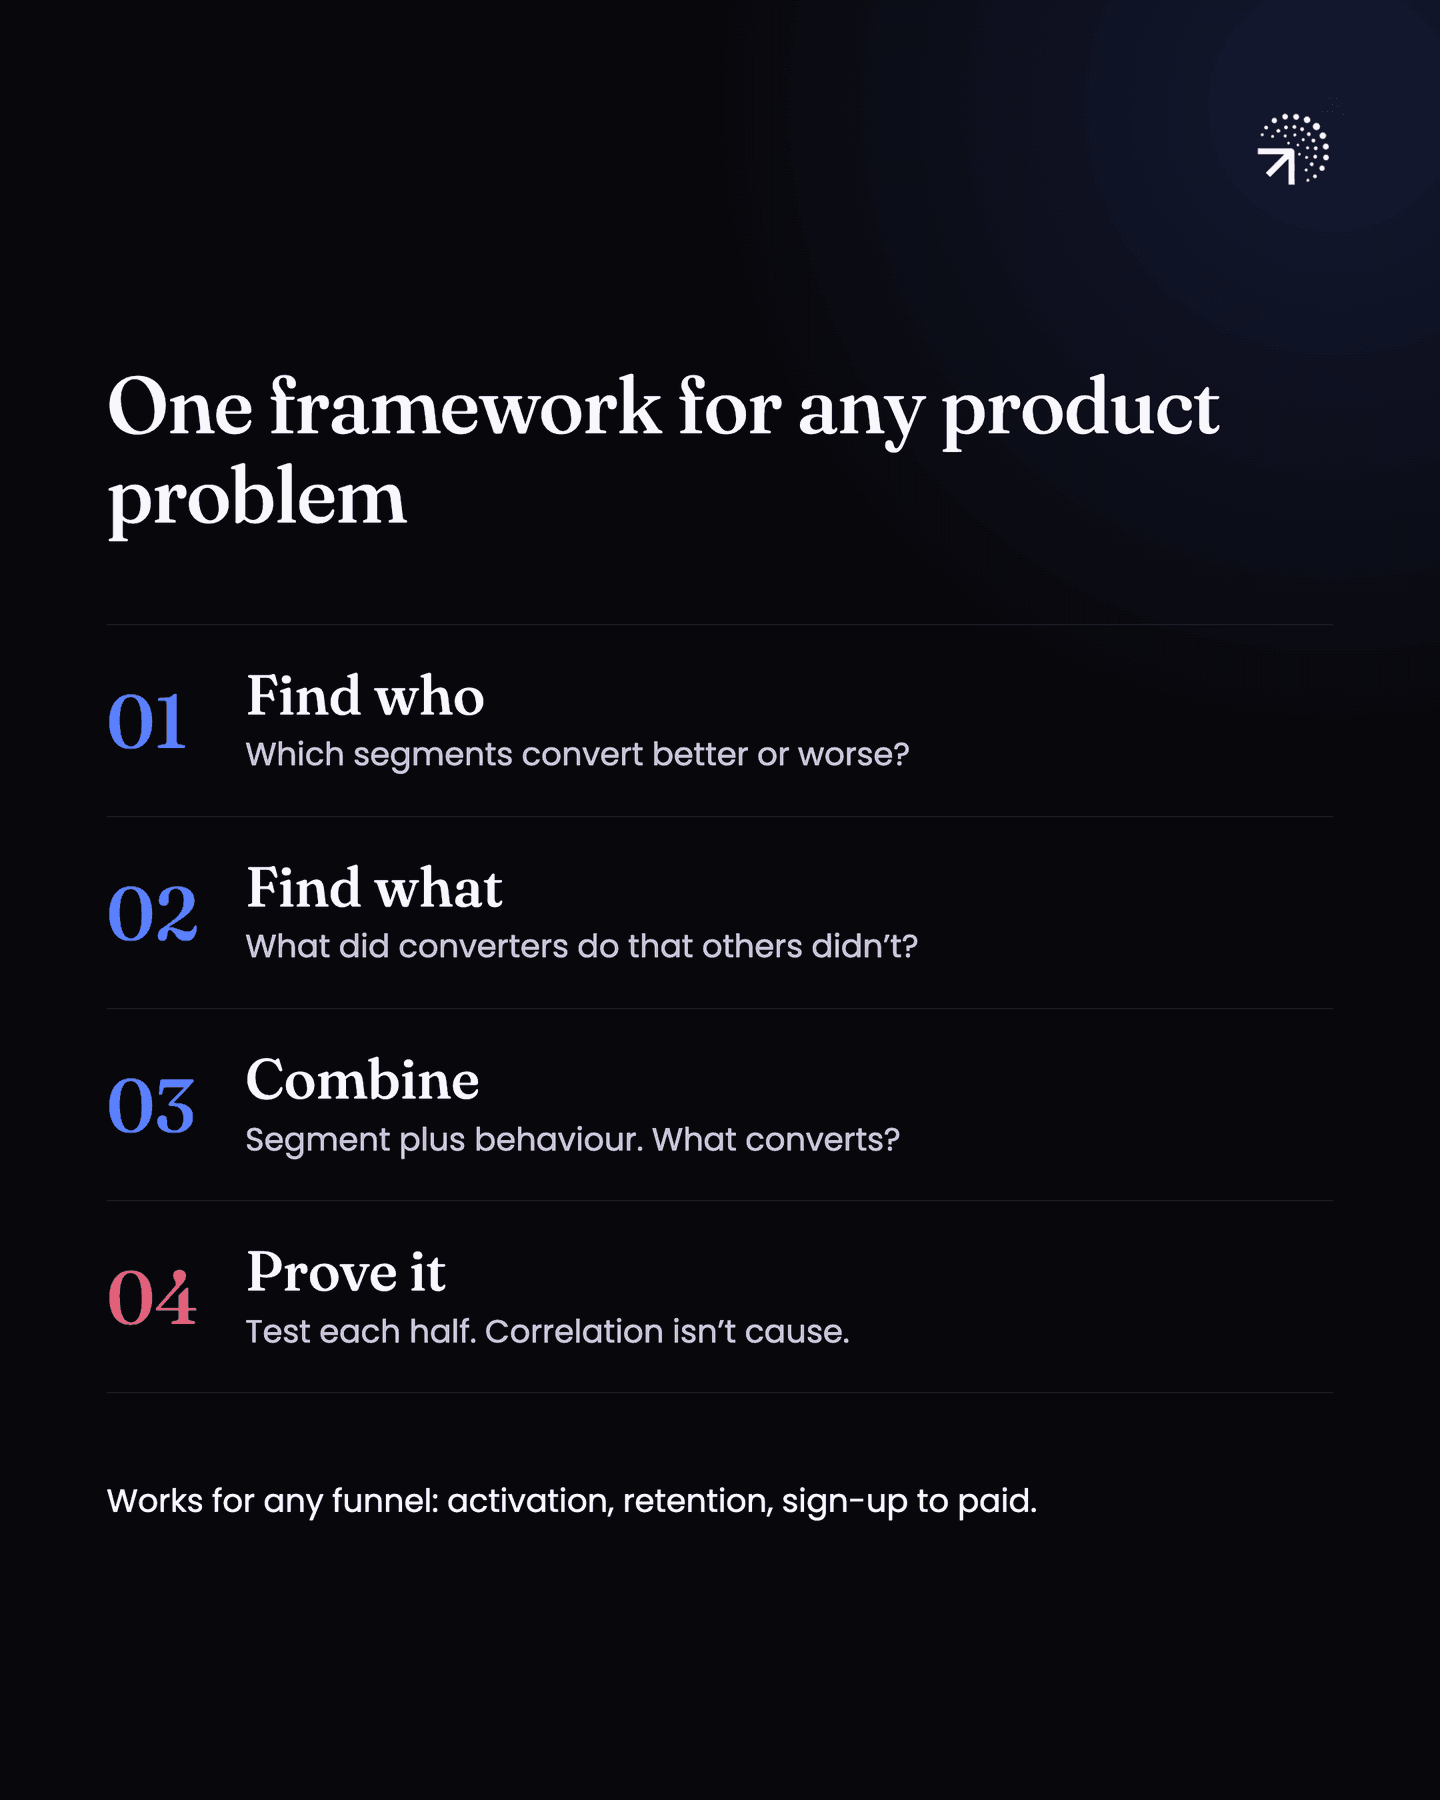
The steps do not change if the number you are trying to move is RetentionThe share of users who come back. Bounded retention counts people who returned on exactly that day; unbounded counts that day or any day after, and the two give very different numbers.Glossary, or activation, or anything else sitting in a FunnelThe steps a user goes through in order. Every product is one, and so is every feature inside it. Counting who reaches each step is what shrinks a whole-product problem to a single step.Glossary. Let me walk you through one example, the rest work the same way.
How do you find which users convert?
Start by splitting the funnel across SegmentA group of users who share something: a country, an acquisition channel, a signup method, a first-session length. Splitting a metric by segment is what makes it actionable.Glossary.
- Signup method
- Marketing channel
- Which product they picked at signup
- Country/ City.
- If you run an onboarding flow with questions in it, every one of those answers is a segment you can break the funnel down by.
You are looking for the segments that convert meaningfully better than the rest, and the ones that convert meaningfully worse.
Put your converters on one side and your non-converters on the other, and look at how much of each group comes from a segment. You might see that 80% of your converters came in through Google, while only 10% of your non-converters did. That is a gap you cannot miss.
For some of them you will already know why. For others you will have no idea. Both are fine. Write them down and leave them alone for now.
That is half the problem.
What did converting users do that others did not?
Did the users who converted do something that the users who did not convert never did?
Most of what you look at will come back looking the same across both groups. A few things will not. Here is where I would start looking at:
- Session time: Converters might spend longer in the product, especially in their 1st session.
- Activation: Whether they activated at all might be different. Activated means they reached the point where the product first did its job for them.
- Coming back: They might have come back on two or three separate days in that first week instead of just once.
Look for the same size of gap you looked for on the segment side. You might see that 90% of your converters did action X within three days of signing up, against 5% of your non-converters. That is a behaviour worth acting on.

Your job here is to find the handful of behaviours that separate the two groups.
How do you combine the segment and the behaviour?
A segment on its own is interesting, and a behaviour on its own is interesting, but neither one tells you what to actually do.
So combine them.
Take your best converting segment. Build a cohort of users who sit inside that segment and who also did the high converting behaviour. A cohort is a saved group of users who match the conditions you set. Here the conditions are one segment plus one behaviour.
Then look at what that cohort converts at, and compare it with your 5%.
Some combinations will convert far above everything else, and that combination is what you want to build around.
Keep the segment and the behaviour separate in your head, because you act on them in very different ways. More on why in the last section.
Other combinations will surprise you in the opposite direction. A segment that looked strong on its own can convert badly once you add the behaviour on top of it. That is just as useful, because it tells you the segment is good, but not with that behaviour. Try it against a different one.
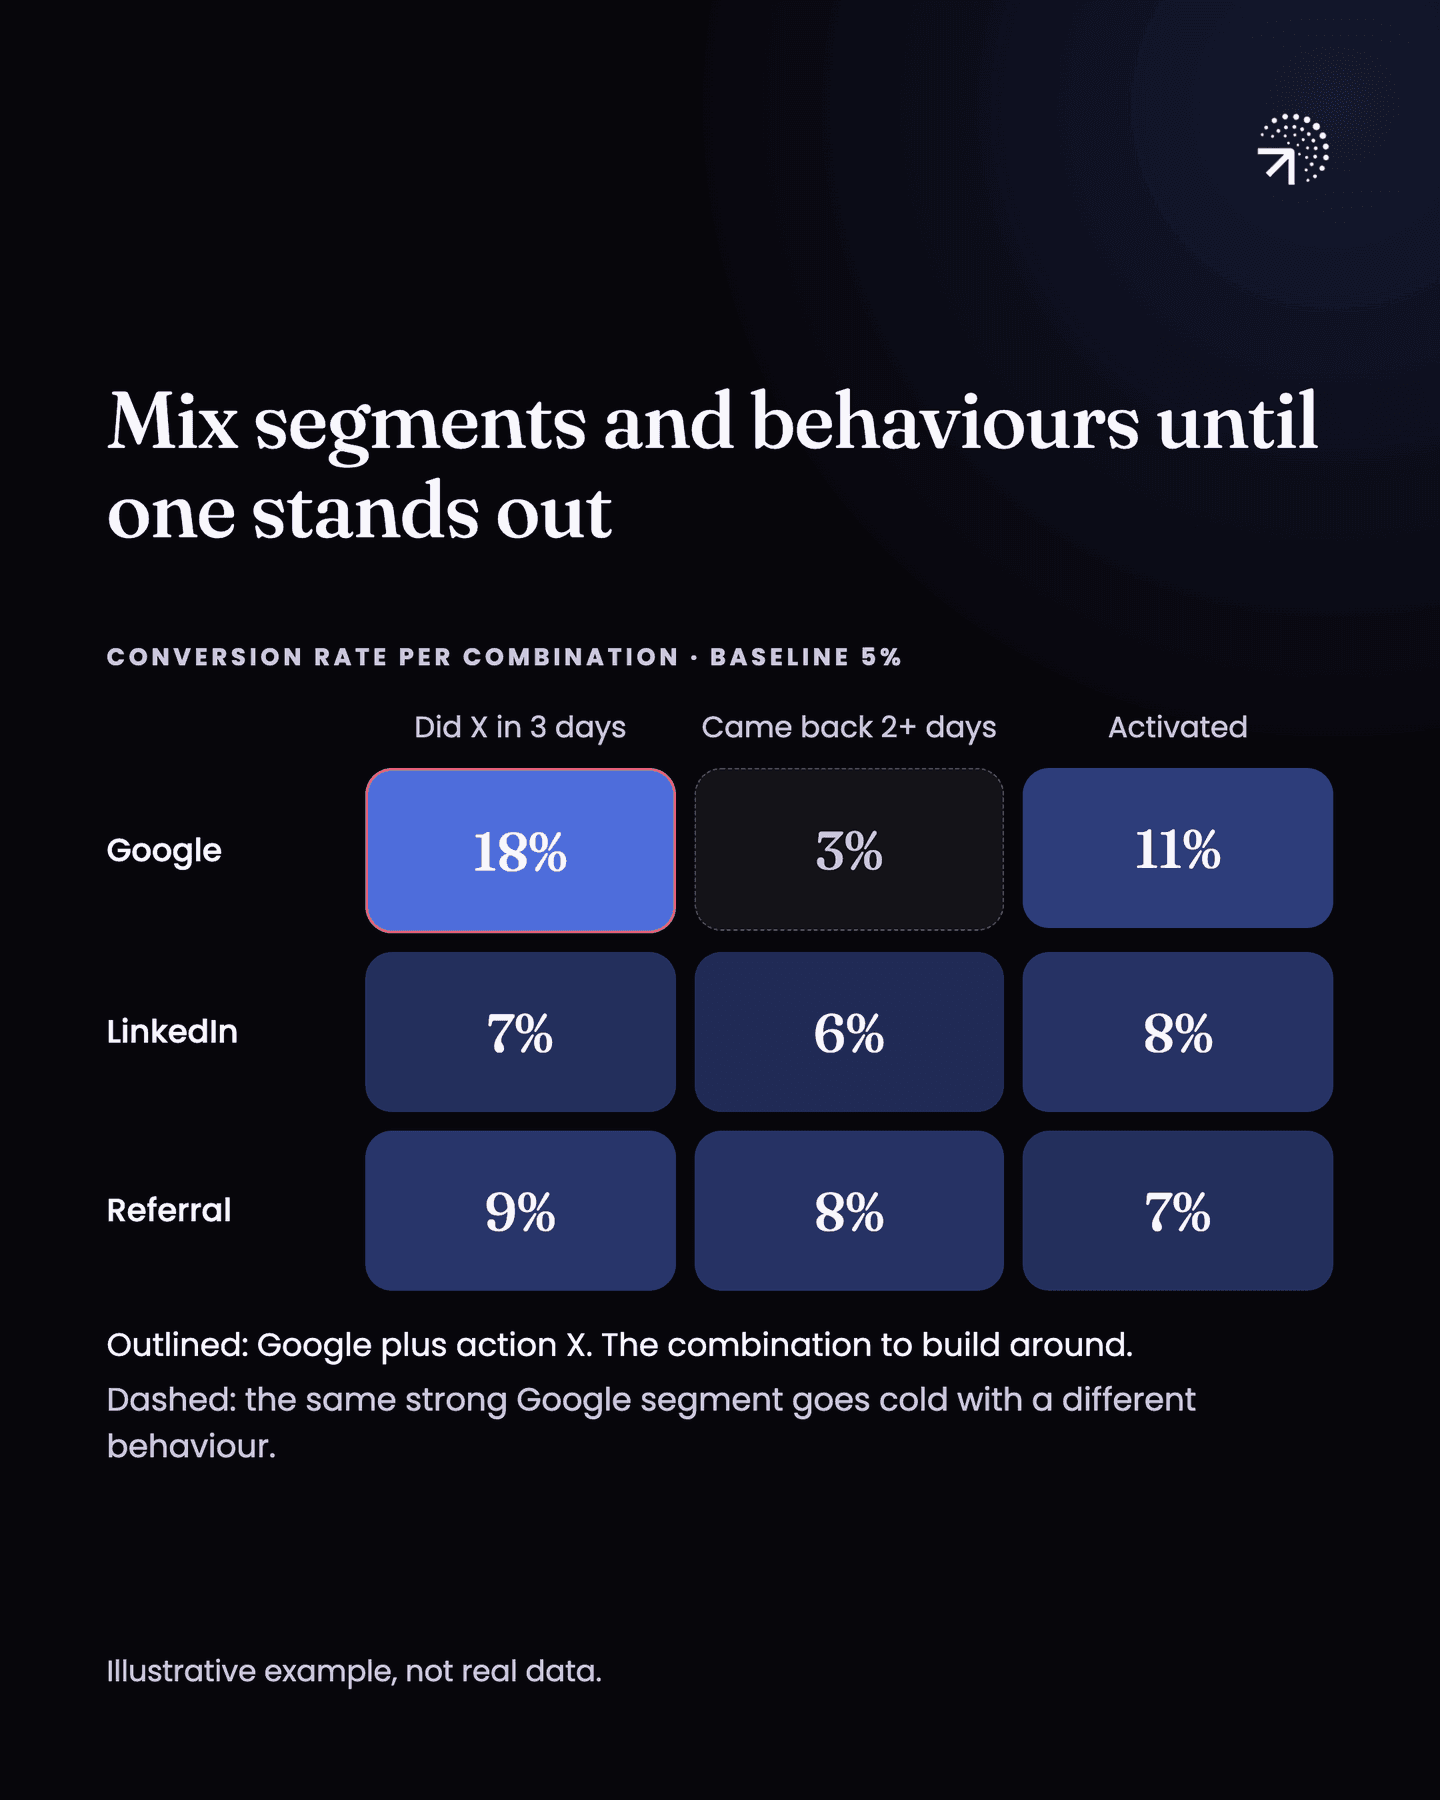
Keep mixing and matching until you can say plainly which combinations convert, which ones do not, and what separates them.
How do you prove what actually caused the conversion?
You have found a CorrelationTwo things showing up together. It is where an insight starts, not where it ends: the users who do the thing may simply be your most motivated ones.Glossary. You have not found a cause.
A correlation means two things show up together. Users in that segment who did that behaviour convert at a higher rate. That does not mean the segment or the behaviour is what made them convert. It might just be what a motivated user happens to look like. "Correlation is not causation" goes deep on this.
The only way to tell the difference is to go and test it. "Experimentation" and "Incremental testing" cover this.
This is also where most companies give up. They try a couple of things, nothing moves, and they move on to something else.
Test the two halves separately, because you reach them in completely different ways. You can go and buy more of a segment. Nobody sells you users who already behave a certain way, so the only way at a behaviour is to push people into it.
| Segment | Behaviour | |
|---|---|---|
| Example | Users who came in through Google | Users who did action X within three days of signing up |
| How you get more of it | Buy more of it | Push existing users into it |
| The experiment | Bring in more users from that segment and watch overall conversion | Get more existing users to do action X in their first three days |
| If conversion does not improve | The segment was never what was doing the work | The behaviour was a symptom of something else |
Start with the segment. Run an experiment that brings in more users from your best converting segment, and watch your overall conversion rate. If it goes up, you were right. If it drops, the segment was never what was doing the work, and something else was.
Then run the behaviour experiment. Get more of your existing users to do action X in those first three days. If conversion improves, the behaviour was your answer. If nothing moves, the behaviour was a symptom of something else and you can cross it off.
Then keep going. One hypothesis, then the next, until you can say exactly what is happening.
This is not an easy problem, and it takes longer than most founders expect. But the framework does not change. Any funnel, any problem statement, any metric you are trying to move.
Find who → find what → put them together → go and prove it.
Common questions
How do you find out why activation is low?
Four steps in order. Work out who converts by splitting the funnel across segments. Work out what those users did that others didn't. Put the two together. Then test which of them actually caused the conversion.
Does this framework work for retention too?
Yes. The steps don't change when the number you're moving is retention, activation, or anything else sitting in a funnel. Only the metric at the top changes.
What is a cohort?
A cohort is a saved group of users who match the conditions you set. In this framework the conditions are one segment plus one behaviour.
Does a high-converting segment prove what causes conversion?
No. It is a correlation: the segment and conversion show up together, but it might just be what a motivated user happens to look like. The only way to tell the difference is to test it with an experiment.